


Article Summary: RSI is more than just an oscillator. Because it is derived from the pulse or force of price, traders can study RSI with trendlines, moving averages or typical chart patterns to get the most of this versatile oscillator.
RSI is far more versatile than most traders give the oscillator credit. However, to unlock the value of the new methods of using RSI requires a quick run-through and a recap of the original rules. Once you grasp the new concepts, you’ll have a new appreciation for the multiple offerings of the RSI.
Traditional Uses of RSI
When traders are first introduced to the RSI, the rules seem too good to be true. When the RSI on the chart you’re reading is below 30 and starts to move back above 30, you can buy. When the RSI on the chart you’re reading is above 70 and starts to move back below 70, you can sell.
Learn Forex: Traditional RSI Signals
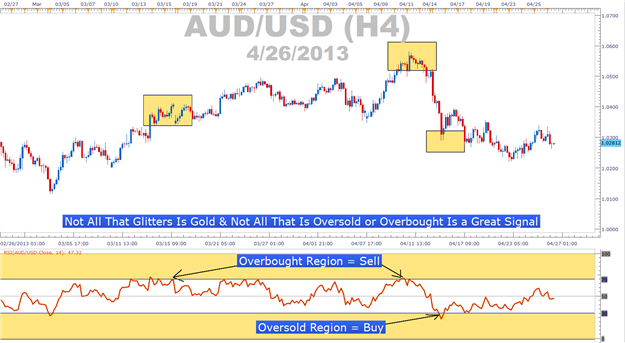
However, as you can see, prices can continue moving higher as the RSI shows overbought for a considerable period of time in a defined uptrend. Likewise, in a clear downtrend, prices can continue moving lower as the RSI shows oversold readings. Naturally, acting on these signals could be harmful o your account equity.
Trendlines, Patterns & Moving Averages - A New Way to Trade with RSI
If you’ve had the unpleasant experience of selling off RSI as an uptrend is picking up steam or buying as a downtrend is getting started then you could benefit greatly from these new methods. To further touch on the diversity of the RSI oscillator, some traders feel that RSI can greatly point to sustainable trending entries as opposed to overbought or oversold entries. Beyond that, let’s visit some advanced application of RSI.
RSI Trendlines
Many traders draw trendlines on their charts by connecting rising low points or troughs in an uptrend or falling highpoints or peaks in a downtrend. Drawing trendlines helps traders find strong entries with a good risk to reward ratio. A similar approach can be applied to the RSI to find a ripe entry when relative strength may be swinging in new direction.
Learn Forex: RSI Trendline Break Helps You Enter Off a Fresh Surge Of Price

Once a trendline break has taken place on the RSI, the trader can take an entry in the direction of the break with a stop near the recent extreme or fractal on the other side of the trendline. You may notice that the price action chart above RSI has stalled right below the ¥100 level against the USD. When you’ve entered off a trendline break, you could place a trailing stop to ensure you’re cutting your loss potential as you’re getting into a new move.
RSI Patterns
Chart patterns help traders find a time when momentum in the previous direction is waning. One of many chart patterns is the simple head and shoulders pattern. This is a price action reversal pattern that can precede big moves and can also be applied to the RSI.
Learn Forex: Head & Shoulder Pattern Applied To RSI on GBPUSD

The rules for entering off patterns on RSI are the same as price action patterns. Above we have received further confirmation of a reason to have sold GBPUSD as the chart was showing a triple tip at the time that RSI was showing a neckline break off of the RSI head & shoulders. Exits off of the trade can be executed once the new resistance is broken or you have met your risk to reward target.
Moving Averages Applied To RSI
Traders who utilize moving averages do so because they want to trade in the direction of the trend. In addition, moving averages often help traders decide when to enter the trade in addition to what side of the trade you want to be on. The same rules can be applied when using a moving average on RSI.
Learn Forex: Applying Moving Averages to the RSI Can Give Trader’s A Needed Edge
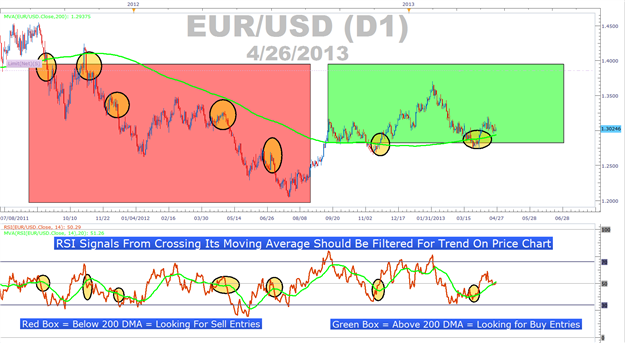
When RSI is above the moving average price is above a moving average, you’re in a clear uptrend. Signals can be derived when the price chart is in a clear uptrend and the RSI crosses above its moving average signaling bullish momentum. This method is utilized by our Technical Analyzer.
All of these methods should be tested on a demo account before applying them to your live trading. Once you get a feel for reading the RSI in this new manner you will have a renewed appreciation for this dynamic tool. If you need help recognizing opportunities like this, feel free to email instructor@dailyfx.com or visit the DailyFX Plus Technical Analyzer.
Happy Trading!
---Written by Tyler Yell, Trading Instructor
To be added to Tyler’s e-mail distribution list, please click here.
Would you like dozens of trade ideas every day with updated charts to identify major levels support and resistance on the currency pair you’re trading?
If so, register for a free trial of our Technical Analyzer here and you’ll be provided with a free temporary login in the video.


