


In one of our live webinars the following question came in: “How do you figure out the probability of your trade hitting its limit?”
Great question…
First off, as is the case with many aspects of trading, there is no absolute answer.
Personally, I will look at the strength of the trend and the amount of room the pair has to move in the direction of my trade. If the trend is weak and there are numerous levels of support or resistance the pair has to move through, the less likely the profit target will be hit.
If the trend is strong and there is no or little support or resistance in its path, the pair will have a greater probability that the profit target (limit) will be hit.
Take a look at the Daily chart of the CHFNZD pair below…
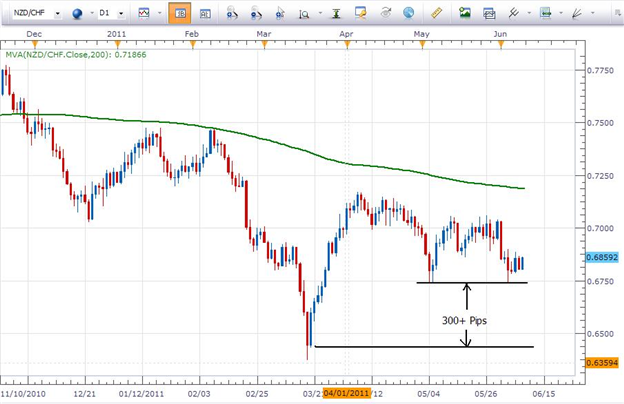
We can see that the pair is in a downtrend since it is trading below the 200 SMA and it has been making lower highs and lower lows. Knowing that, we are looking to short the pair for a higher probability trade.
So, should the pair break support at roughly .6740, there is no support below there until around .6440…about 300 pips. This is not to say that the pair will drop like a rock if that level is breached or even that it will slowly trade down to .6440. It merely shows a setup that in my mind that has potential.
On the other hand take a look at the Daily chart of the GBPAUD below…

This pair is in a downtrend and we would be looking for opportunities to sell the pair. Unlike the CHFNZD pair however, it has several levels of support standing in the way of the trade achieving its ultimate profit target at about 1.5040.
In looking at the two charts it is readily apparent that there are some “roadblocks” that may prevent the GBPAUD from limiting out whereas there are no roadblocks (support levels) between the entry and the limit on the CHFNZD pair.
This is one way to determine the potential for a pair to reach its profit target.


