USD/JPY, GOLD PRICE FORECAST
- Gold prices advance, but fail to push above cluster resistance
- USD/JPY lacks directional conviction, with the pair trading slightly below the 200-day simple moving average
- This article explores the technical profile for gold and USD/JPY, focusing on important price thresholds that could be relevant heading into the final trading sessions of 2023
Trade Smarter - Sign up for the DailyFX Newsletter
Receive timely and compelling market commentary from the DailyFX team
Most Read: US Dollar in Risky Waters, Technical Setups on EUR/USD, GBP/USD, Gold
Gold prices (XAU/USD) trended higher on Tuesday in thin trading after the Christmas holidays, rising about 0.7% to $2,065, bolstered by the pullback in the U.S. dollar, which inched towards its lowest point since late July.
Following Tuesday’s advance, XAU/USD has arrived at the doorsteps of an important resistance region, spanning from $2,070 to $2,075. Previous attempts to break through this ceiling on a sustained basis have been unsuccessful, so history could repeat itself this time.
In the event of a bearish rejection from current levels, support appears at $2,050, followed by $2,010. Bulls must defend this floor tooth and nail – failure to do so could rekindle downward momentum, laying the groundwork for a drop toward $1,990. On further weakness, the focus turns to $1,975.
On the other hand, if buyers manage to push prices decisively above $2,070/$2075, upward impetus could gather pace, creating the right conditions for the precious metal to start consolidating above $2100. Continued strength could pave the way for a retest of the all-time high at $2,150.
Wondering how retail positioning can shape gold prices? Our sentiment guide provides the answers you are looking for—don't miss out, get the guide now!
| Change in | Longs | Shorts | OI |
| Daily | 0% | 0% | 0% |
| Weekly | -4% | -8% | -6% |
GOLD PRICE TECHNICAL CHART
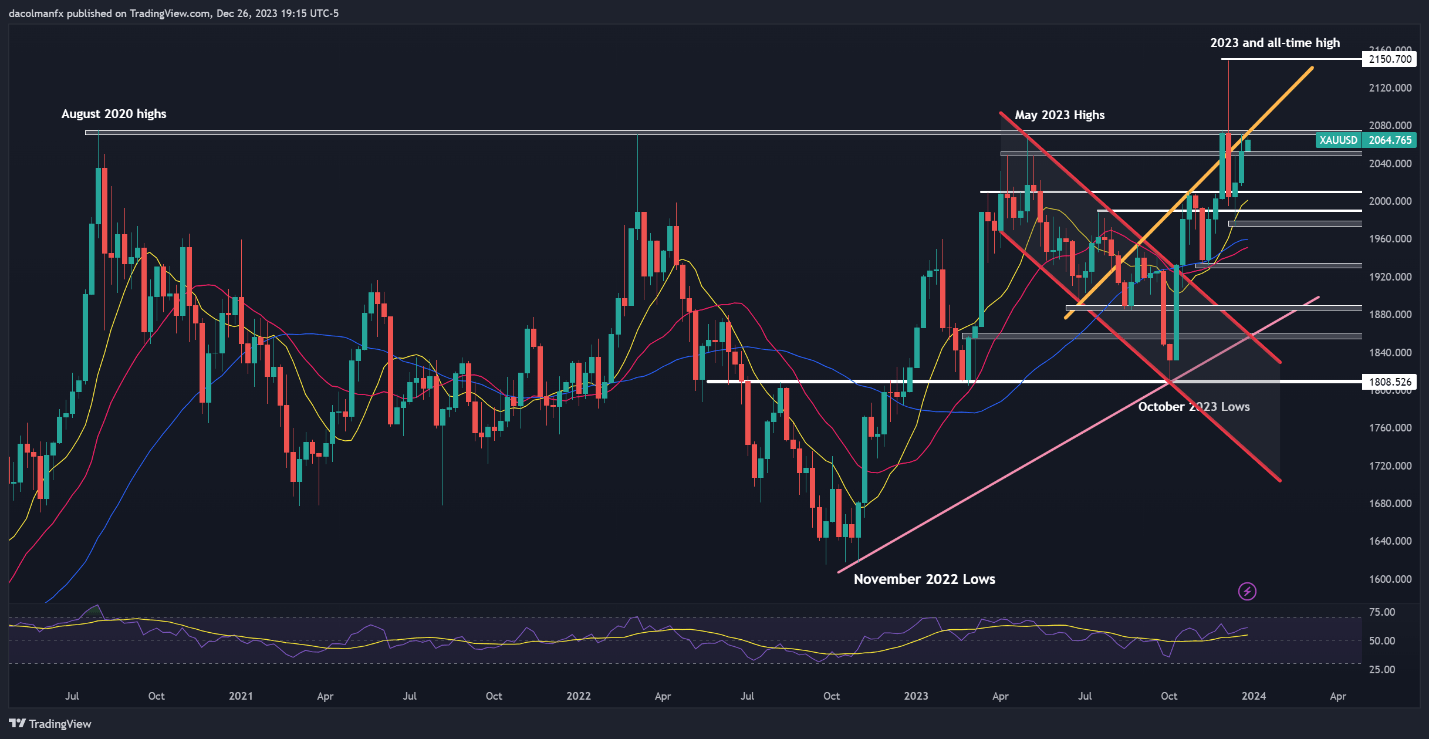
Gold Price Chart Created Using TradingView
Explore exclusive insights and tailored strategies for the Japanese yen by downloading our “How to Trade USD/JPY” guide.

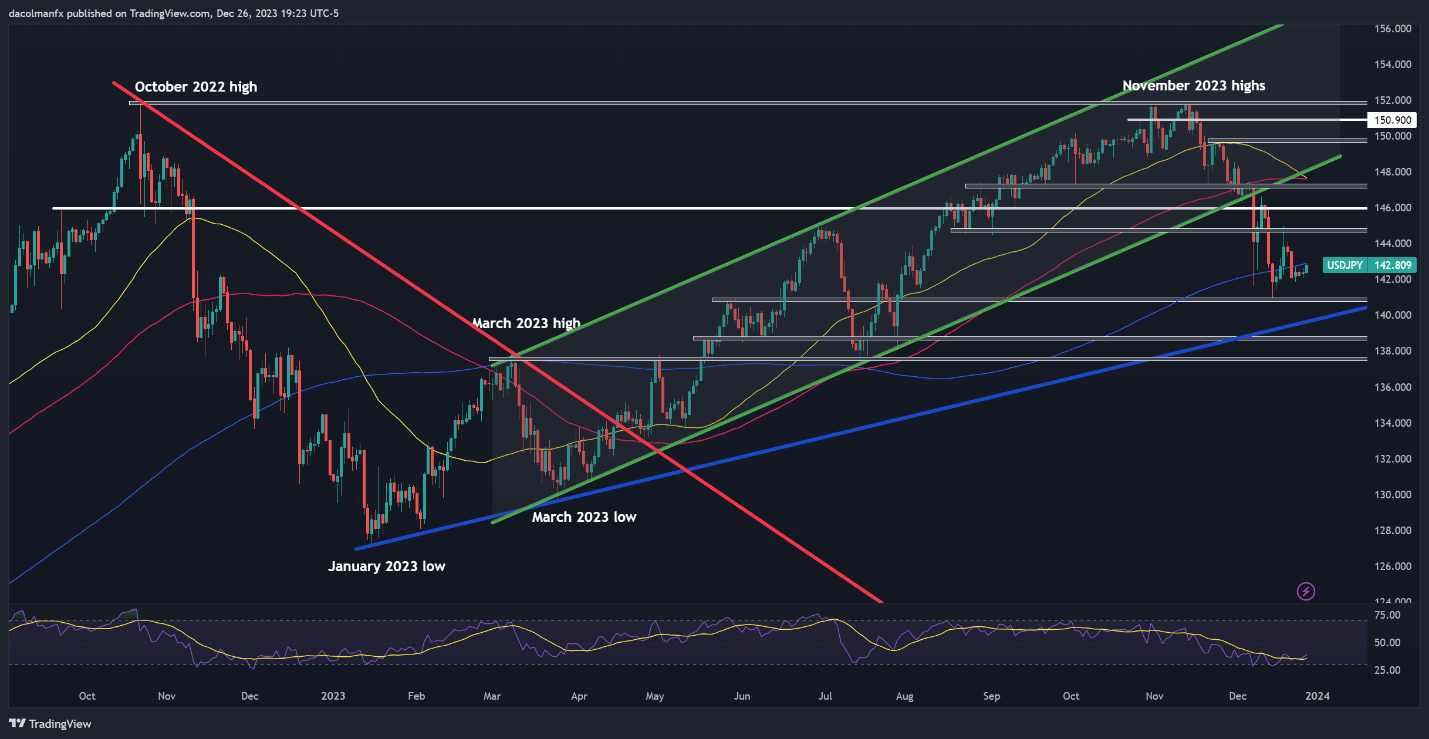
USD/JPY TECHNICAL ANALYSIS
USD/JPY ticked up modestly on Tuesday but was unable to recapture its 200-day simple moving average. If prices remain below this indicator on a sustained basis, selling pressure could resurface and gather impetus, paving the way for an eventual drop toward the December lows at 140.95. While this technical area could offer support during a retracement, a breakdown might steer the pair towards 139.50.
On the other hand, if buyers take charge and propel the exchange rate above the 200-day SMA, resistance is located at 144.80. Overcoming this hurdle will prove challenging for the bulls, but a successful breakout could establish favorable conditions for an upward push toward the 146.00 handle. On further strength, all eyes will be on 147.20.
USD/JPY TECHNICAL CHART