


USD/CAD PRICE, CHARTS AND ANALYSIS:
- The Loonie Finally Loses Steam as USDCAD Breaks Higher Out of the Recent Range.
- S&P Sees Sluggish Growth Ahead Just as Canadian Inflation Eyes a Second Wave.
- The Rise in US Yields and Selloff in US Treasuries are Hindering the Loonie and this Looks set to Continue in the Short-Term.
- To Learn More About Price Action,Chart Patterns and Moving Averages, Check out the DailyFX Education Series.

Read More: Gold Falters as US Yields and the DXY Advance, $1900 at Risk
USDCAD has finally broken out of the recent 5-day range as the DXY advance gathers momentum. The Canadian Dollar had been on a bit of a rally thanks to a sharp increase in the most recent inflation print coupled with an extraordinary rise in WTI Oil prices. There were also comments out today from S&P who stated that the economic outlook for Canada shows signs of sluggish growth just as the economy looks set to battle resurgent inflation.
The recent breakout on USDCAD has largely come about as the DXY finds its feet and continues its rally higher. The Greenback has largely been supported by the “higher for longer” narrative and the safe haven appeal of the US Dollar. Not even a potential Government shutdown can dampen the mood at the moment. The major contributor, however, seems to be the US Bond market as the perceived Government shutdown prompts market participants into early profit taking on carry trade strategies. US Yields however continue to surge, holding at 2007 levels.
Trade Smarter - Sign up for the DailyFX Newsletter
Receive timely and compelling market commentary from the DailyFX team
The recent developments around US Treasuries do not bode well for commodity currencies such as Emerging Market currencies and could also turn out to be a hindrance to the WTI linked CAD. WTI for its part has found some support today continuing its move higher and on course for a hammer candle close on the daily timeframe.
WTI OIL Daily Chart
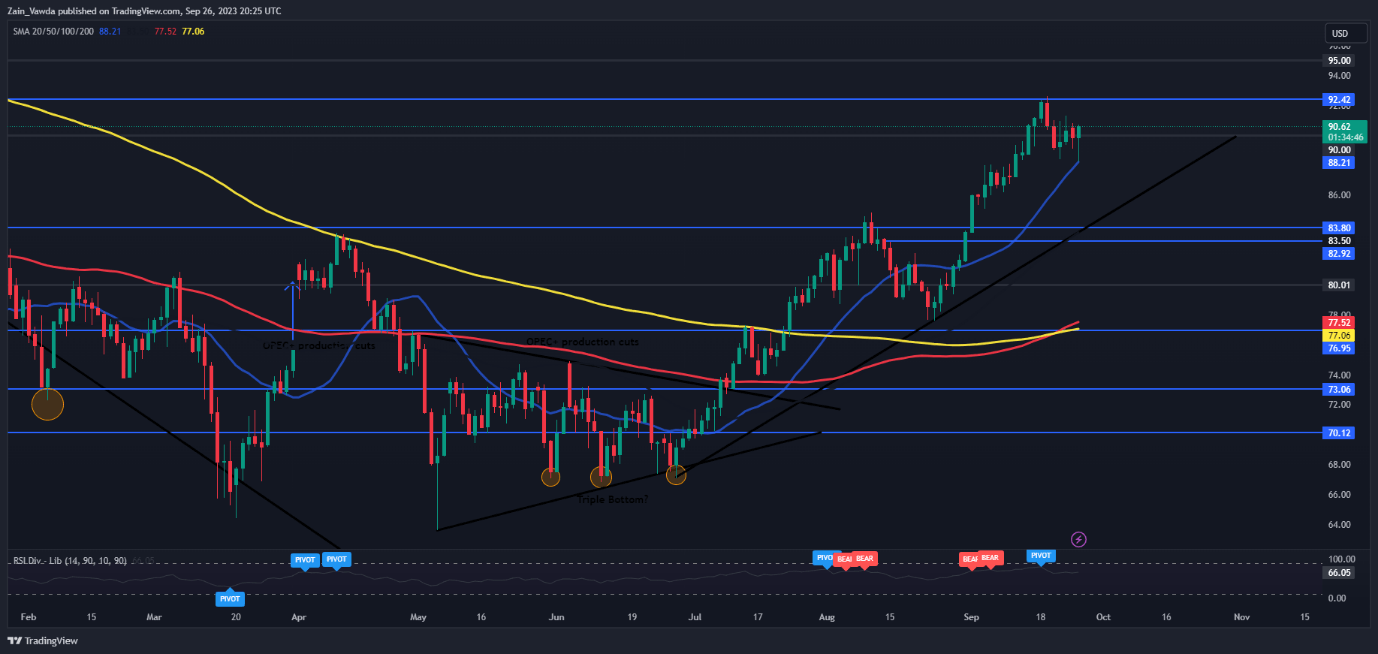
Source: TradingView, Created by Zain Vawda
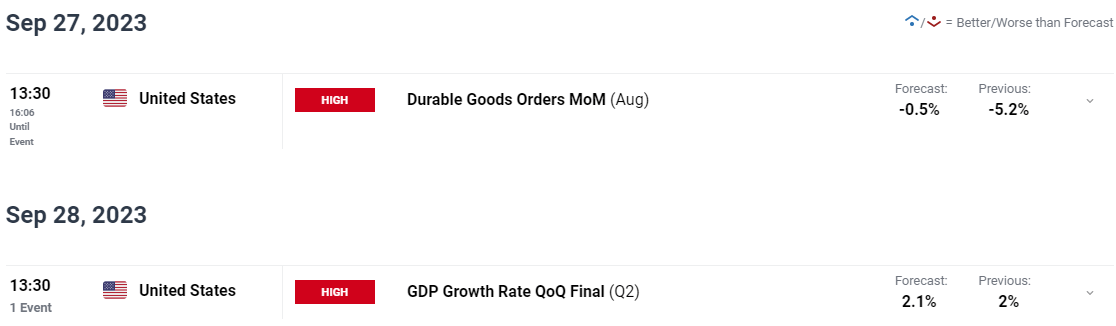
ECONOMIC CALENDAR AND EVENT RISK AHEAD
The next seven days bring very little in terms of Canadian data and risk events which are dominated by US news. There are a host of events on the docket as well as a couple of Federal Reserve policymakers scheduled to speak. I will be paying close attention to the PCE data on Friday but even that would require a significant miss or beat to have any material impact on the US dollar.
For all market-moving economic releases and events, see the DailyFX Calendar
TECHNICAL ANALYSIS AND FINAL THOUGHTS
USDCAD
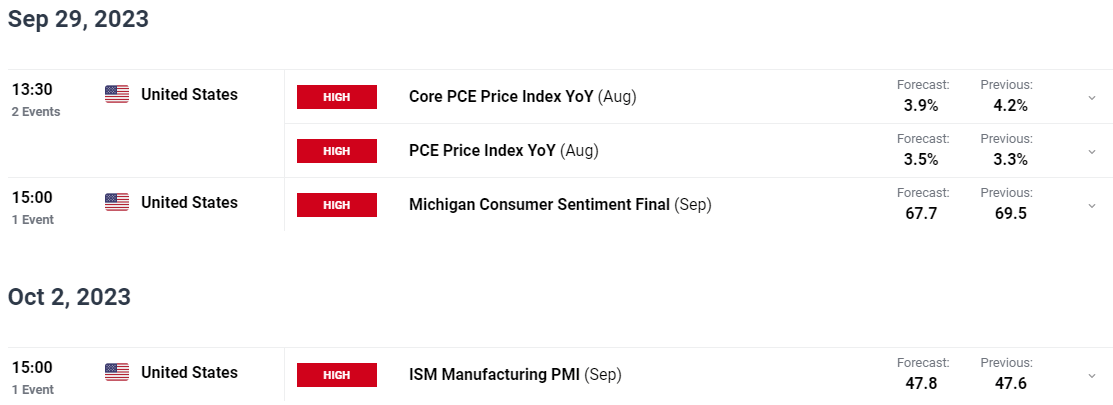
USDCAD ended last week with a hanging man candle, however the age-old adage that “wicks never lie” may be playing itself out this week. Having continued its recent consolidative price action yesterday, we have finally had a breakout of the range today as the pair eyes a return to recent highs.
Admittedly looking at the daily timeframe there are many hurdles on the downside with support offered by both the 100 and 200-day MAs. A breach of these support areas may bring a retest of support around the 1.3250 handle into play.
Looking at the upside potential for the pair and immediate resistance rests at 1.3540 which is the 20-day MA while a move higher brings key resistance at 1.3650 into focus.
USD/CAD Daily Chart
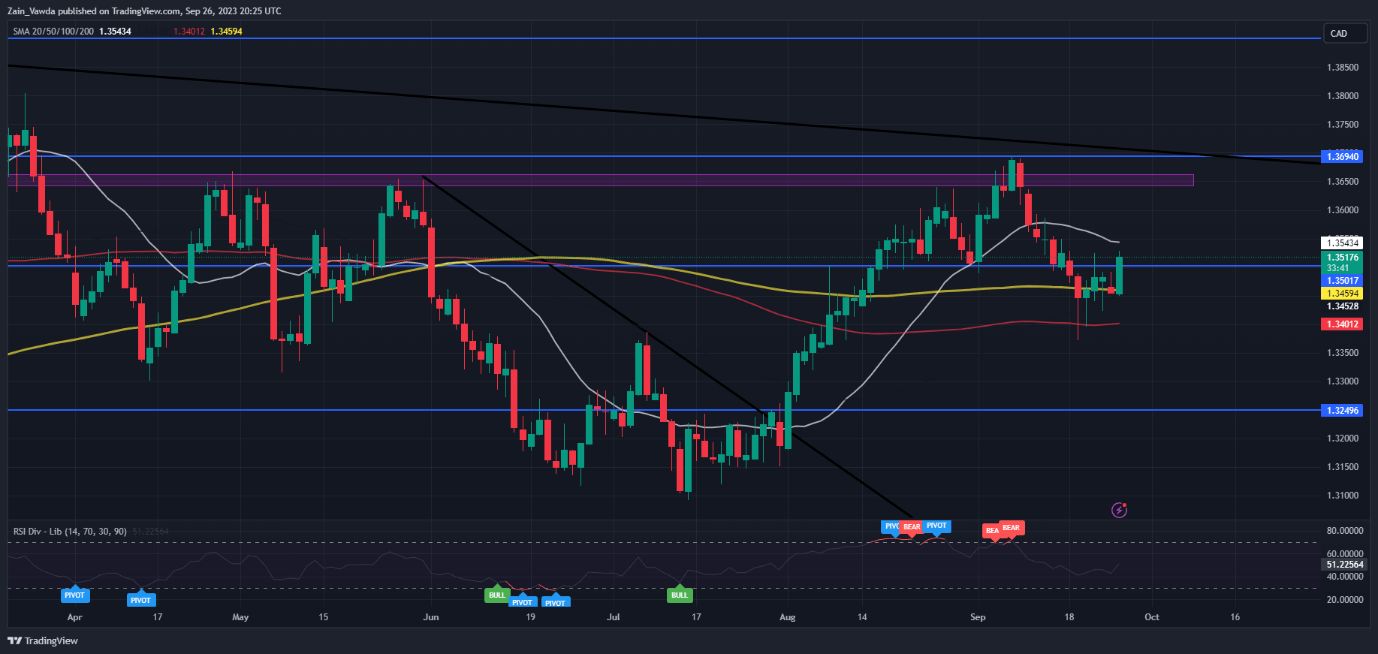
Source: TradingView, prepared by Zain Vawda
IG CLIENT SENTIMENT
Taking a look at the IG client sentiment data and we can see that retail traders are currently net SHORT with 57% of Traders holding short positions.
For Full Breakdown of the Daily and Weekly Changes in Client Sentiment as well Tips on How to use it, Get Your Free Guide Below
| Change in | Longs | Shorts | OI |
| Daily | 30% | -22% | -7% |
| Weekly | -2% | 1% | 0% |
--- Written by Zain Vawda for DailyFX.com
Contact and follow Zain on Twitter: @zvawda


