Article written by IG Chief Market Analyst Chris Beauchamp
Dow Jones, Nasdaq 100, CAC 40 Analysis, Prices, and Charts
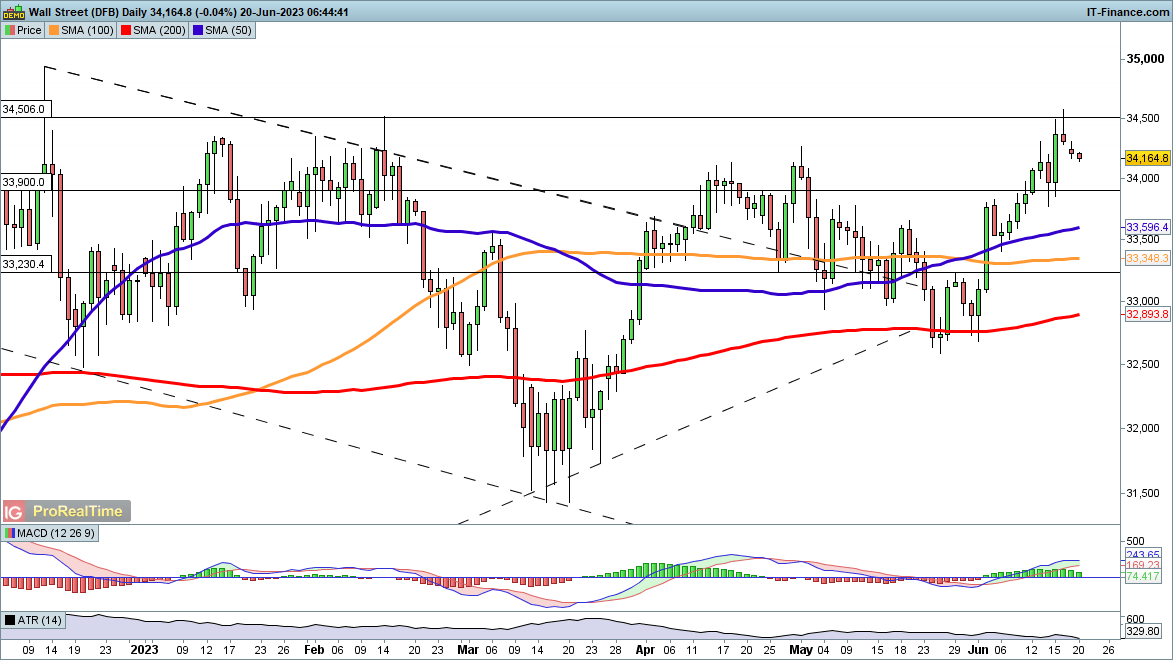
Dow futures point towards gains
Friday’s price action saw the index briefly hit its highest level since December. Monday’s thin trading witnessed a modest drop, but the general move higher from the May low is intact.
Further upside targets 34,661 from early December, and then on to the December high at 34,941. Short-term trendline support from late May underpins the index, so a move back below 34,000 would be needed to suggest some near-term consolidation or potential pullback.
Beyond the December high, the April 2022 high of around 35,800 come into play.

Dow Jones Daily Price Chart - June 20, 2023
Trade Smarter - Sign up for the DailyFX Newsletter
Receive timely and compelling market commentary from the DailyFX team
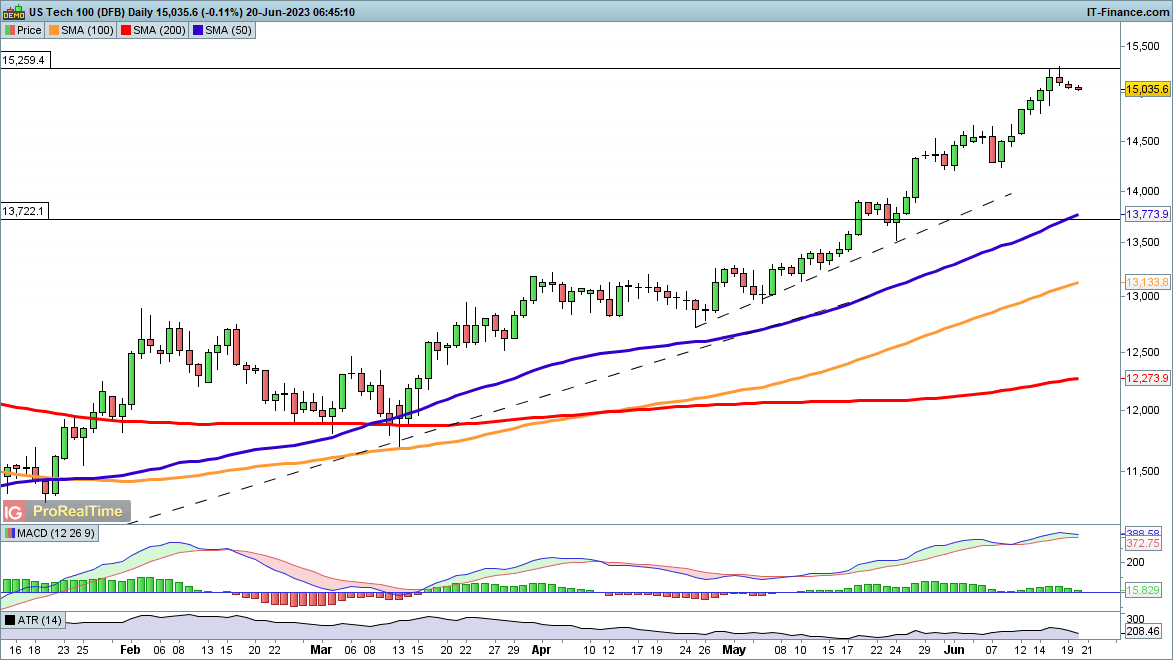
Nasdaq 100 drifts in early trading
The Nasdaq’s run shows no sign of slowing, though having reached the March 2022 highs again and after a 1300-point move in a month some consolidation should be expected. Given how overstretched the index is, a pullback towards trendline support from late May might wipe 500 points off the index. However, this would still leave the uptrend intact.
A move back below 14,000 would be needed to suggest a more substantial pullback.
Nasdaq 100 Daily Price Chart - June 20, 2023
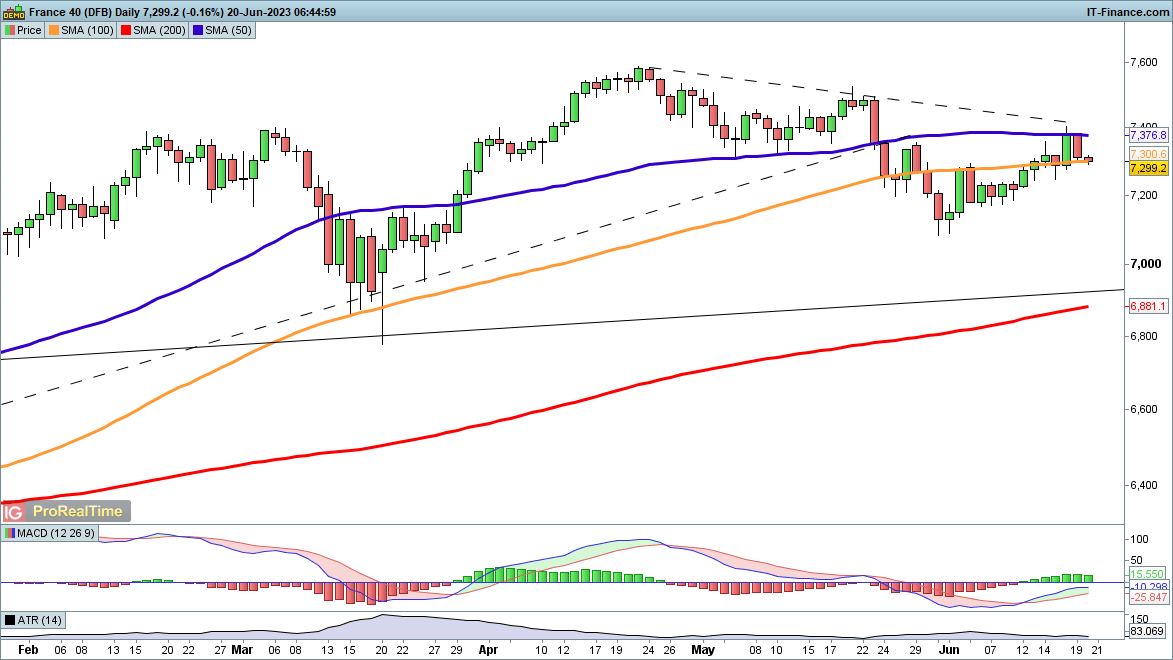
CAC 40 pushes off Monday low
European markets hit some selling on Monday, and the CAC40 fell back from the 50-day SMA. Short-term trendline support from the May low could soon be tested, and if this is broken and the 100-day SMA is lost the May low could come back into view.
A revival above the 50-day SMA will rapidly bring the index to a test of trendline support from April, and above 7400 the 7500 and 7587 become the next upside targets.
CAC 40 Daily Price Chart - June 20, 2023