


S&P 500, SPX, NASDAQ 100, NDX, DJIA - OUTLOOK:
- The S&P 500 is testing support on the 200-DMA.
- The Nasdaq 100 index risks a bearish head & shoulders pattern.
- What are the outlook and the key levels to watch in the three US indices?
Looking for actionable trading ideas? Download our top trading opportunities guide packed with insightful tips for the fourth quarter!

S&P 500: Make or break?
The lower low created this week relative to the early-October lows highlights the growing risk of a deeper setback in the S&P 500 index, which is now testing the 200-day moving average, near the early-October low of 4215, and the lower edge of a declining channel since July. A decisive break below could expose the downside toward the end-April low of 4050.
The index last week pulled back from key converged resistance on the 89-day moving average. The failure of the index to touch the upper edge of the channel was a sign of underlying weakness. The turnaround in the daily cloud structure is another reflection of changing dynamics, as highlighted in late September. See “US Indices Risk Support Test After Hawkish Fed: S&P 500, Nasdaq Price Action,” published September 21.
S&P 500 Daily Chart
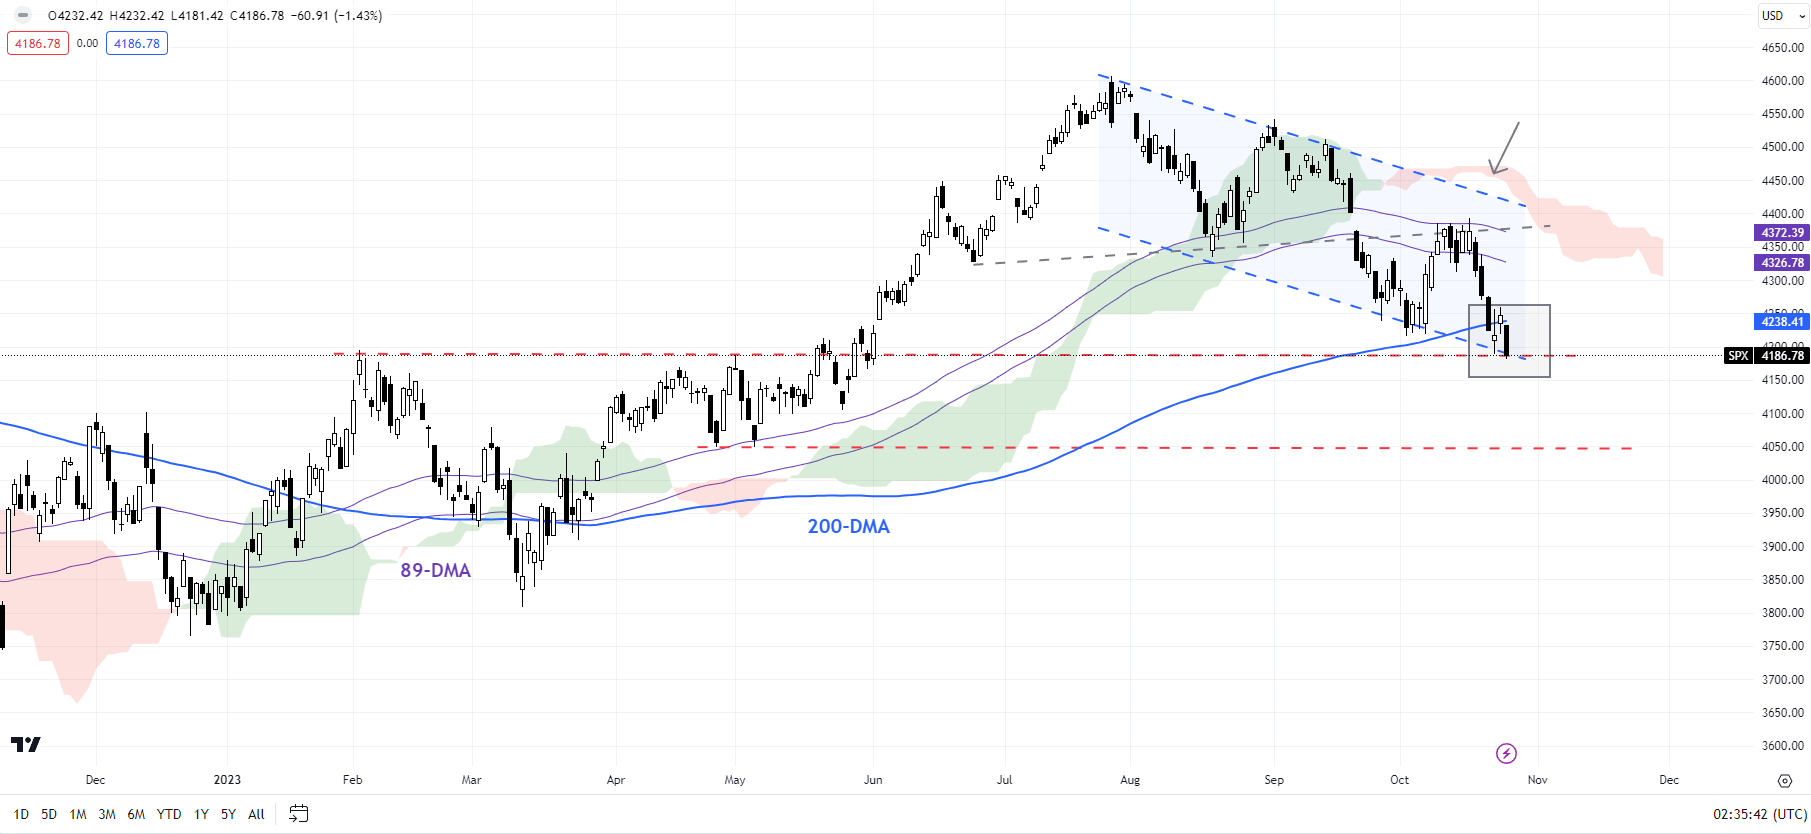
Chart Created by Manish Jaradi Using TradingView
Zooming out from a multi-week perspective, the weakness since August reinforces the broader fatigue, as pointed out in previous updates. See “US Indices Hit a Roadblock After Solid Services Print: S&P 500, Nasdaq,” published September 7; “US Indices Rally Beginning to Crack? S&P 500, Nasdaq Price Setups,” published August 3; “S&P 500, Nasdaq 100 Forecast: Overly Optimistic Sentiment Poses a Minor Setback Risk,” published July 23.
Elevate your trading skills and gain a competitive edge. Get your hands on the U.S. dollar Q4 outlook today for exclusive insights into key market catalysts that should be on every trader's radar.

Nasdaq 100 Daily Chart
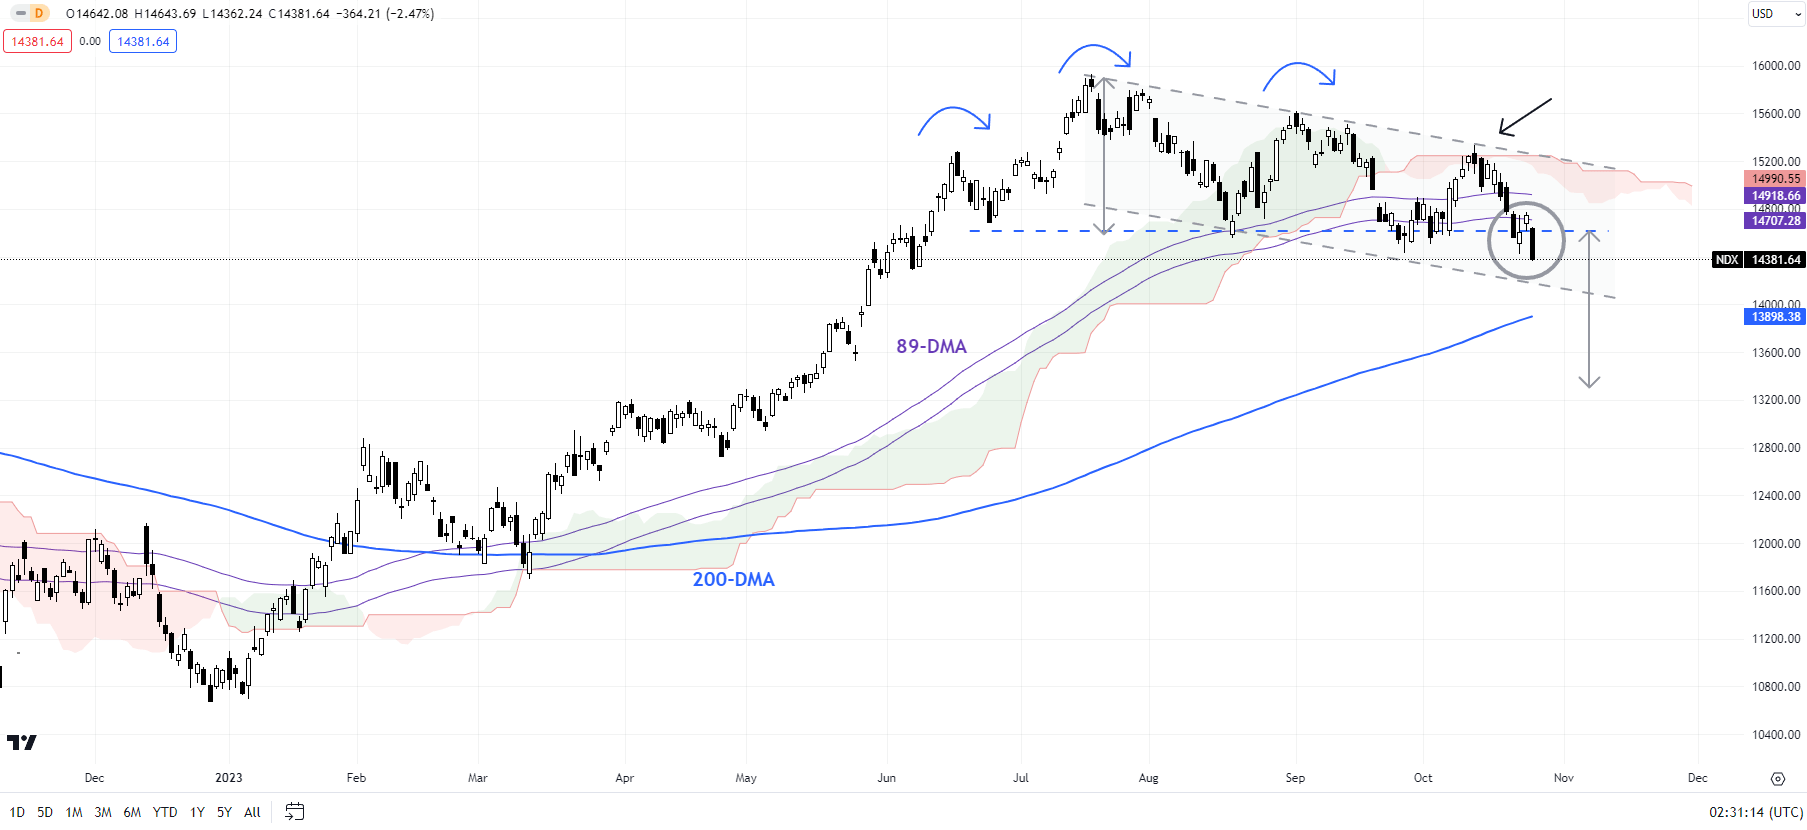
Chart Created by Manish Jaradi Using TradingView
Nasdaq 100: Retests crucial support
The Nasdaq 100 index is looking weak as it retests vital cushion area at the September low of 14435. Below that, the next support is on the lower edge of a declining channel since July, slightly above the 200-day moving average (now at about 13900). The index has fallen sharply in recent sessions from a significant hurdle on the upper edge of the channel. Subsequent support is at 13300 (the 50% retracement of the 2023 rise).
The weakness since mid-2023 is a reflection of broader fatigue on higher timeframe charts, as highlighted in arecent update, raising the risk of a gradual weakening, similar to the May-October drift lower in gold. For more discussion, see “Is Nasdaq Following Gold’s Footsteps? NDX, XAU/USD Price Setups,” published August 14.For the immediate downward pressure to fade, at minimum, the index needs to break above the October high of 15335.
Dow Jones Industrial Average Weekly Chart
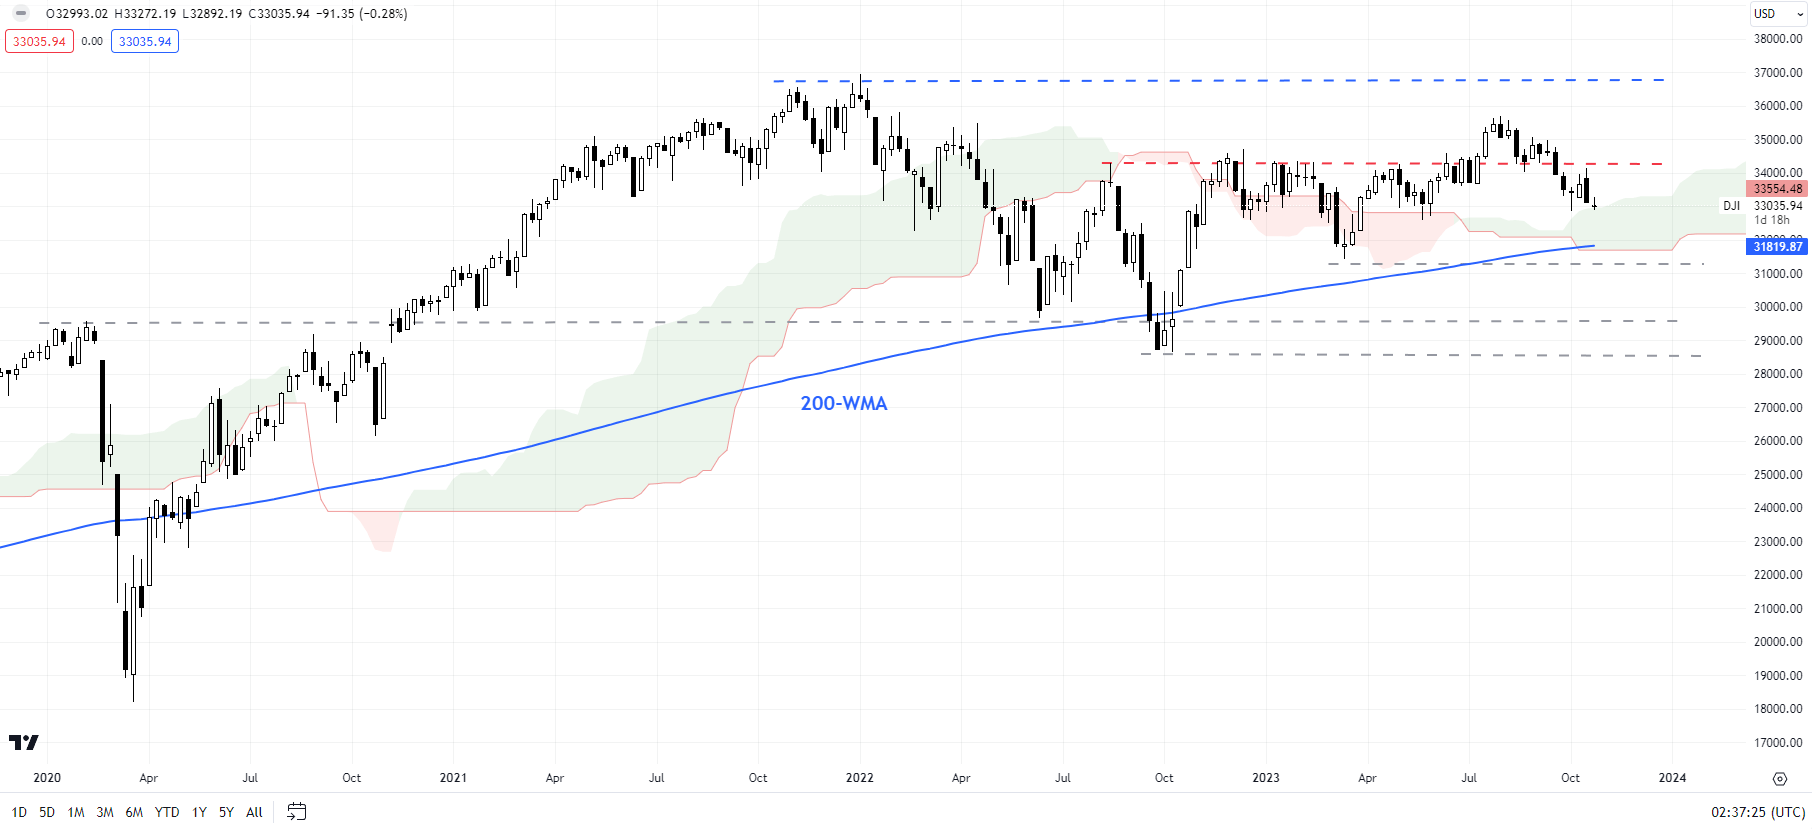
Chart Created by Manish Jaradi Using TradingView
Dow Jones Industrial Average (DJIA): Within the range
The failure to hold above crucial resistance on a horizontal trendline since mid-2022 has raised the prospect of a false bullish break. Any break below the 200-day moving average, near the March low of 31430 would confirm the development. Such a break would reinforce the broader sideways trend prevailing since early 2022. A break below 31430 could open the way toward the end-2023 low of 28715.
Curious to learn how market positioning can affect asset prices? Our sentiment guide holds the insights—download it now!


