

US Dollar Vs Euro, British Pound, Australian Dollar – Outlook:
- USD retreat on Wednesday could an early sign of cracks in the rally.
- USD hurt by below-expected US PMI data.
- What is the outlook and the key levels to watch for EUR/USD, GBP/USD, and AUD/USD?

There are growing signs that the US dollar could be in the process of making an interim top. To be fair, this wouldn’t necessarily imply that the uptrend is over.
Downbeat US manufacturing and services PMI on Wednesday triggered a material slide in the US dollar globally, even as Euro area and UK factory output contracted. The outsized response to otherwise not-so-bad (single set of) data -- at least in terms of levels of the PMIs compared with its peers – is a reflection of the broader mood. This is especially true given the most recent set of data, including industrial production, retail sales, and housing starts looked solid. For more discussion, see the previous update “US Dollar Looks Tired Ahead of Jackson Hole: EUR/USD, GBP/USD, USD/JPY Price Setups," published August 22.
DXY Index Daily Chart
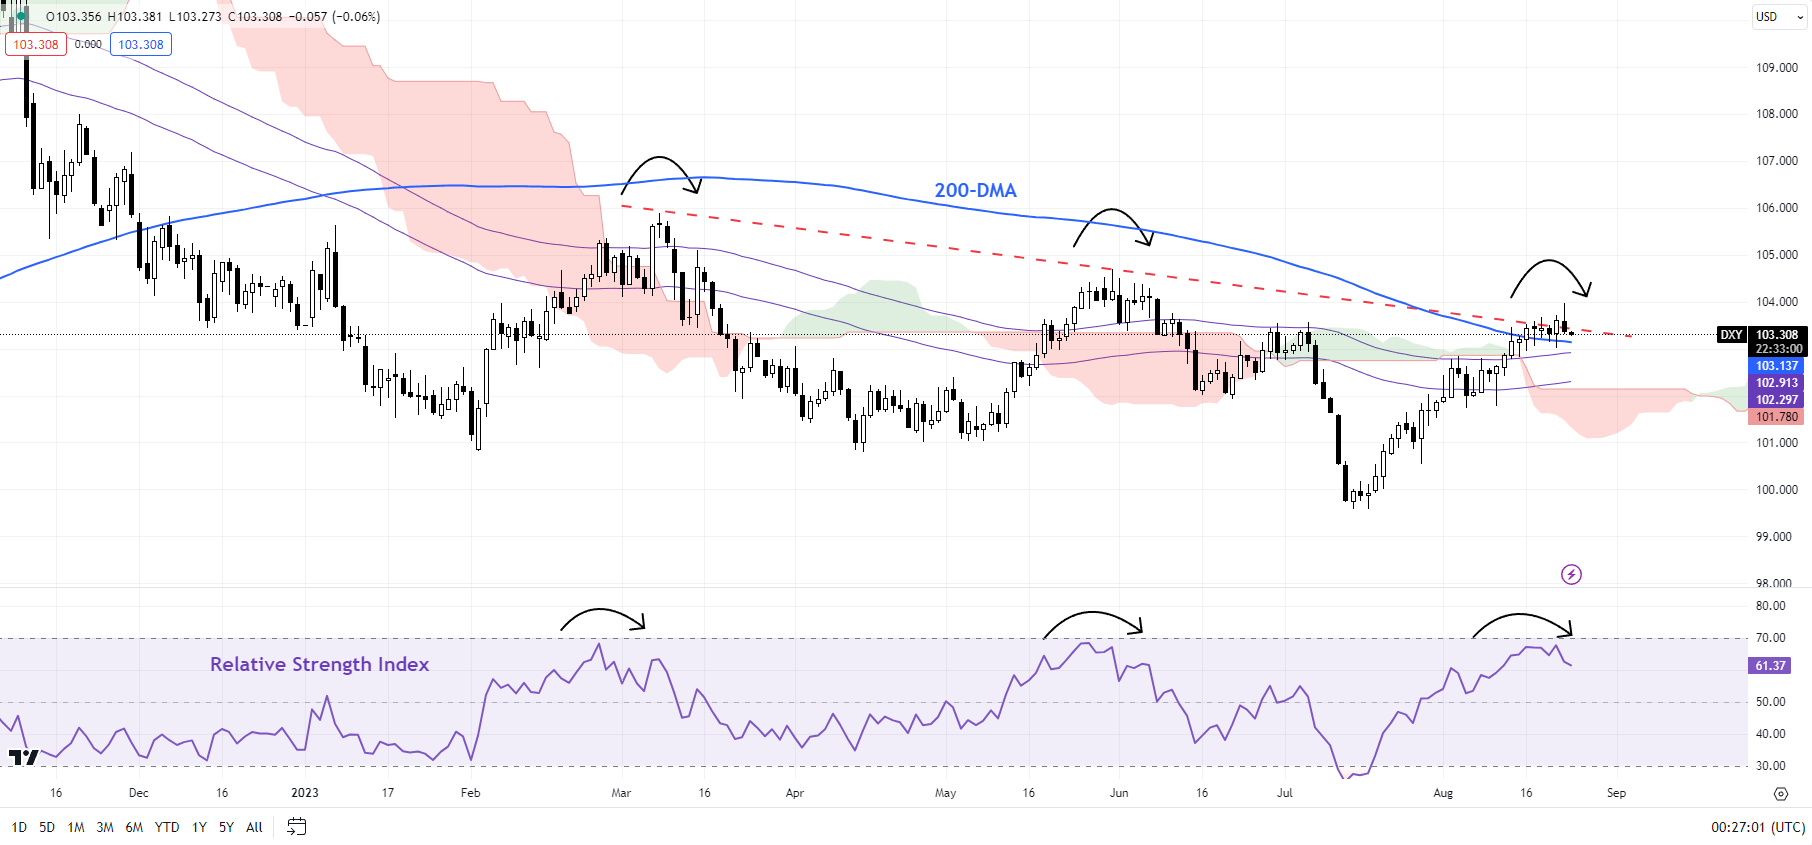
Chart Created by Manish Jaradi Using TradingView
The key focus is now on US Federal Reserve Chair Jerome Powell is due to speak on Friday at the three-day meeting of central bankers at the Jackson Hole Economic Symposium beginning Thursday. A balanced, data-dependent assessment could provide an excuse for a further retreat in the US dollar globally. However, if Powell’s tone turns out to be hawkish guided by the recent strong US data, then USD’s retreat could be limited.
DXY Index 240-Minutes Chart
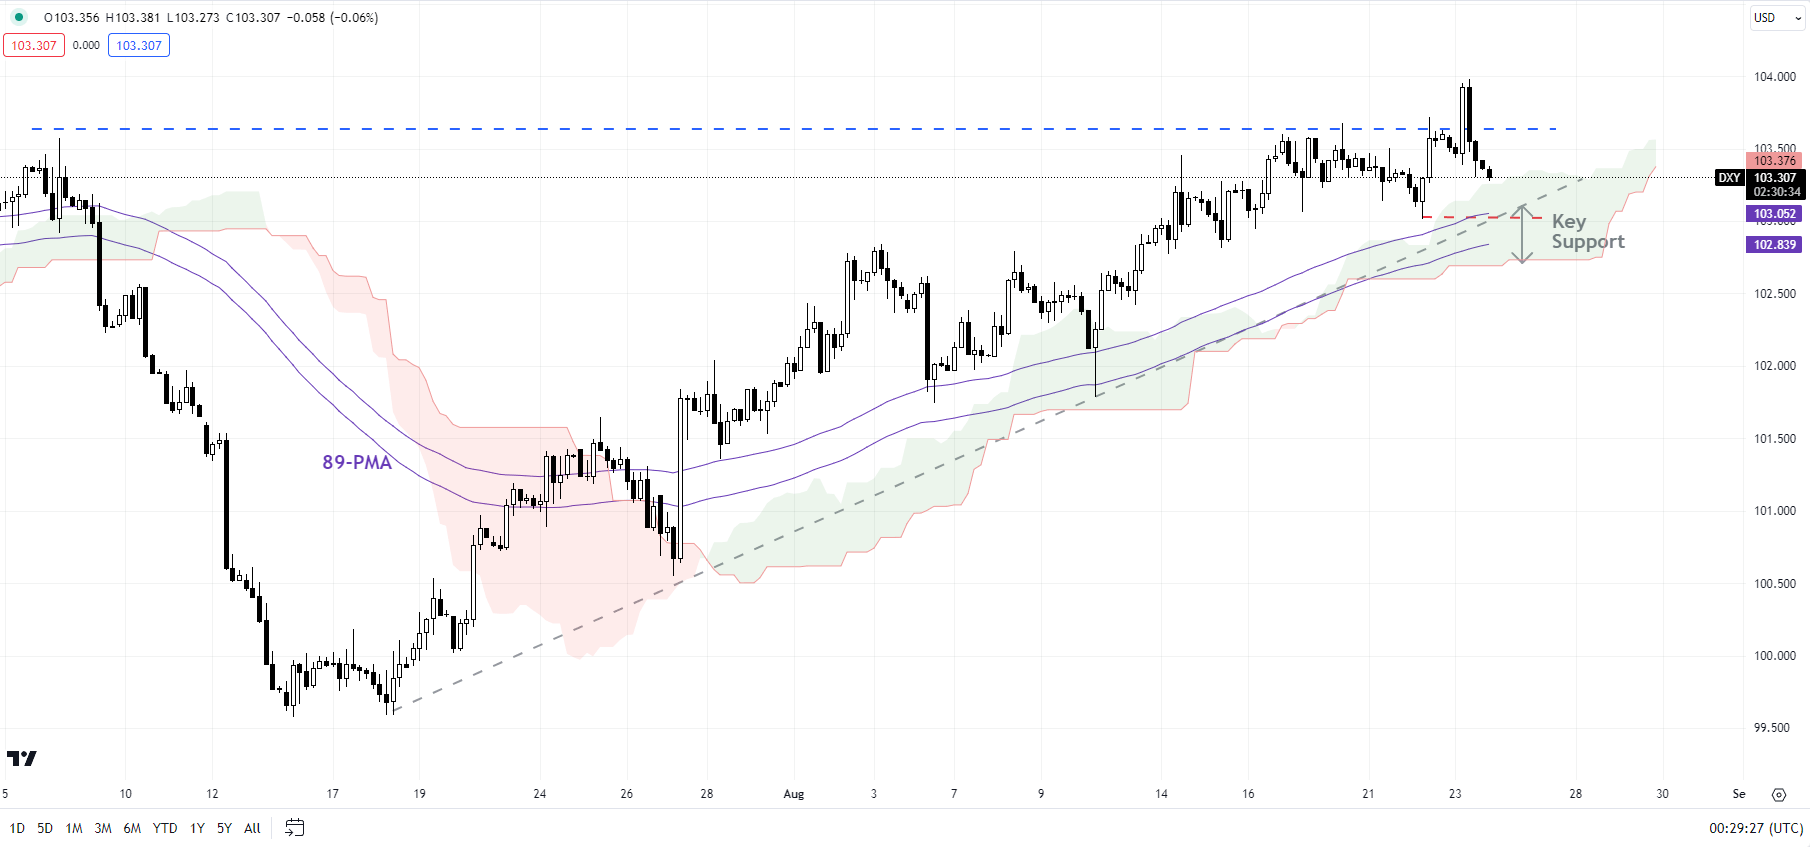
Chart Created by Manish Jaradi Using TradingView
On technical charts, the DXY Index (USD index) has been struggling to clear above a stiff barrier on the 200-day moving average and a downtrend line from early 2023. Back-to-back doji / small body candles in recent days coupled with an inverted hammer on Wednesday raise the odds that the USD rally could be about to stall. Zooming on to the hourly charts, any break below the immediate converged floor at 102.50-1.0300, including the 89-period moving average and the lower edge of the Ichimoku cloud on the 240-minute charts would confirm that the upward pressure had faded.
EUR/USD 240-Minutes Chart
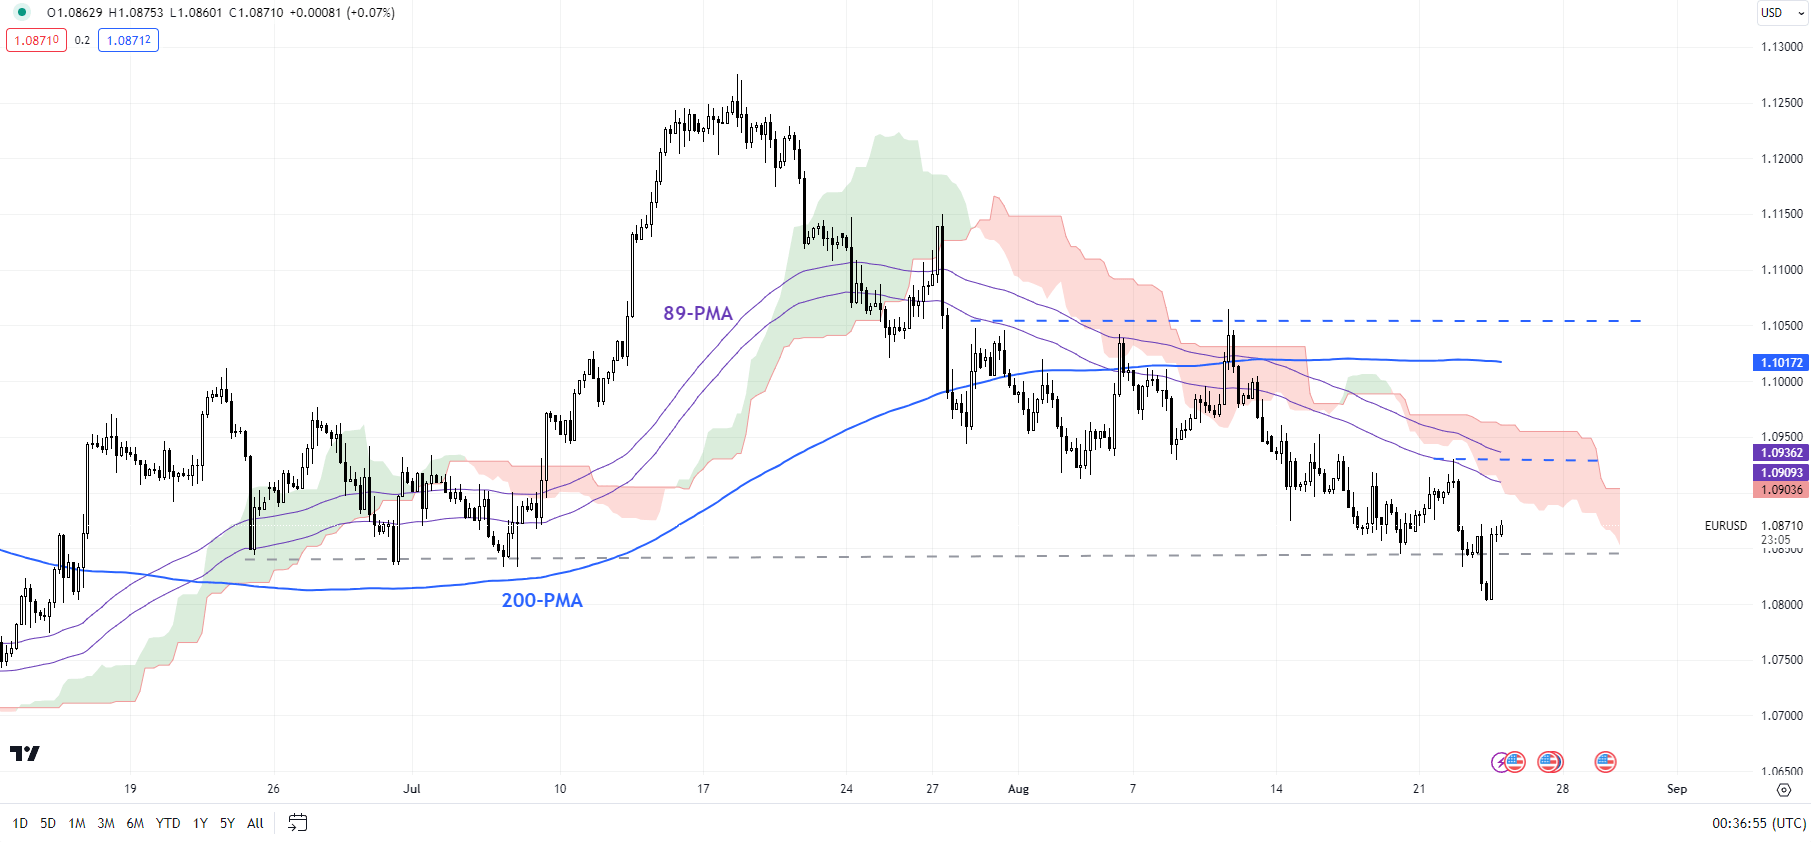
Chart Created by Manish Jaradi Using TradingView
EUR/USD: Awaiting confirmation of a low
EUR/USD is holding above a crucial floor at the 89-day moving average, the 200-day moving average, and the lower edge of the Ichimoku cloud on the daily chart. While a necessary condition to ensure a low is in, the hold above support on its own isn’t sufficient to conclude the worst is over. The pair would need to rise above the initial resistance at 1.0900-1.0950 for the immediate downside risks to fade. Subsequent resistance is at the August 10 high of 1.1065.
GBP/USD 240-Minutes Chart
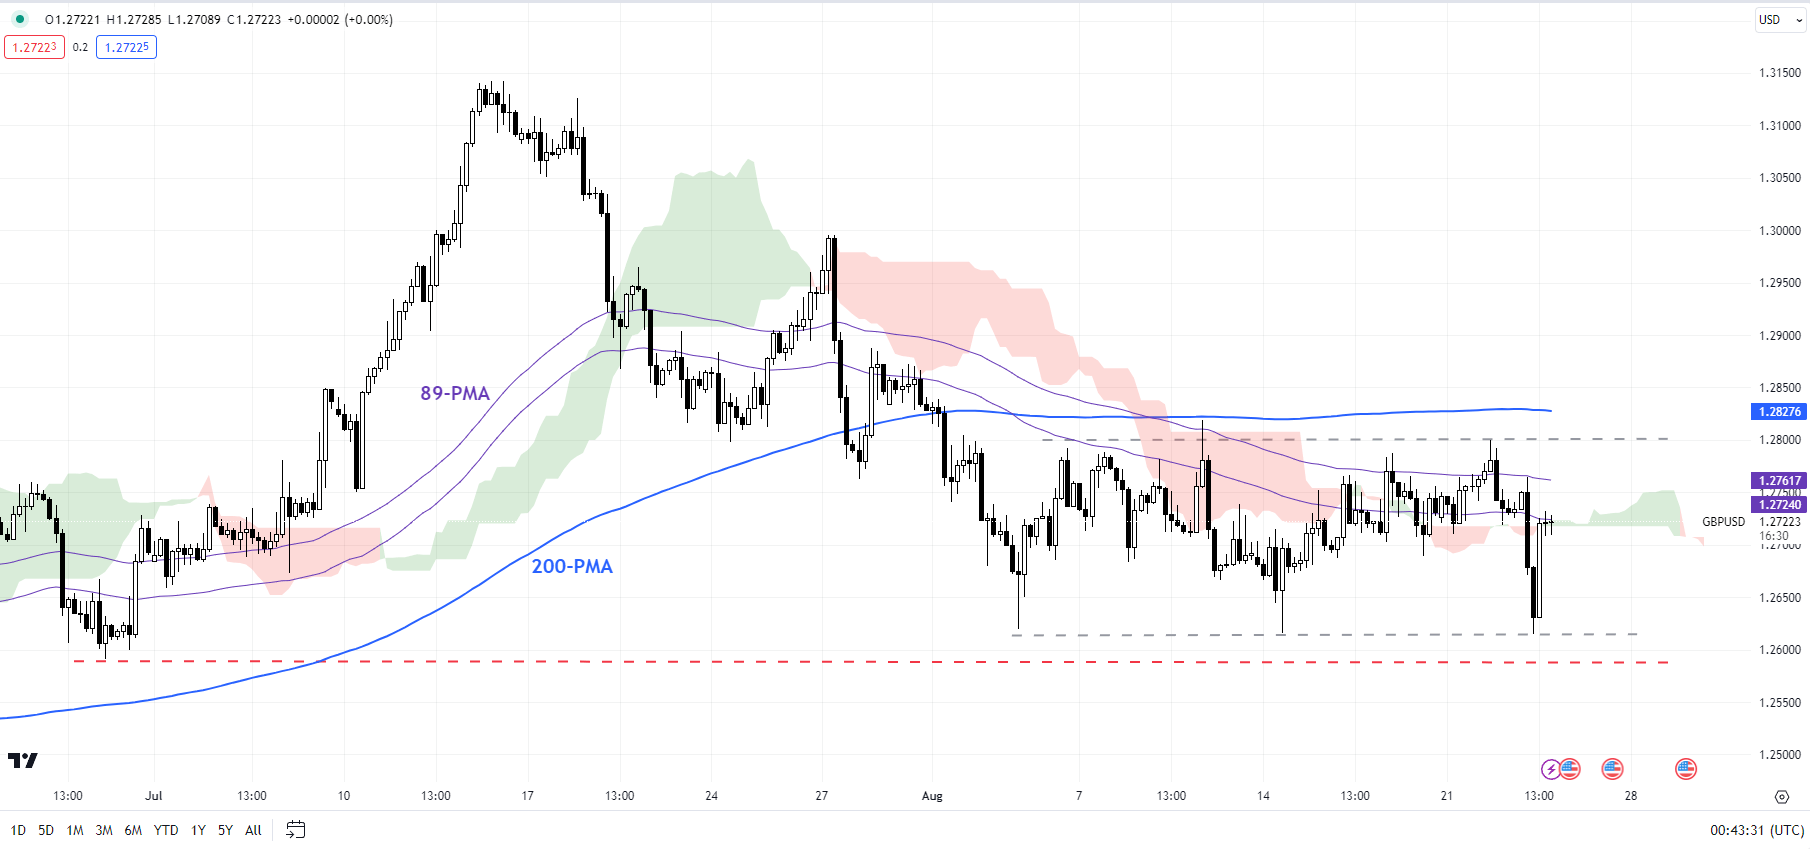
Chart Created by Manish Jaradi Using TradingView
GBPUSD: Settles in a range
GBP/USD appears to have settled in a narrow range this month of 1.2600-1.2800. The lower edge also coincides with the 89-day moving average, the lower edge of the Ichimoku cloud on the daily chart, and the end-June low of 1.2600. There is plenty of support under 1.2600 to limit any downside, including the 200-day moving average and the May low of 1.2300. On the upside, GBP/USD needs to rise above the August 10 high of 1.2820 for the immediate downward pressure to fade.
AUD/USD Daily Chart
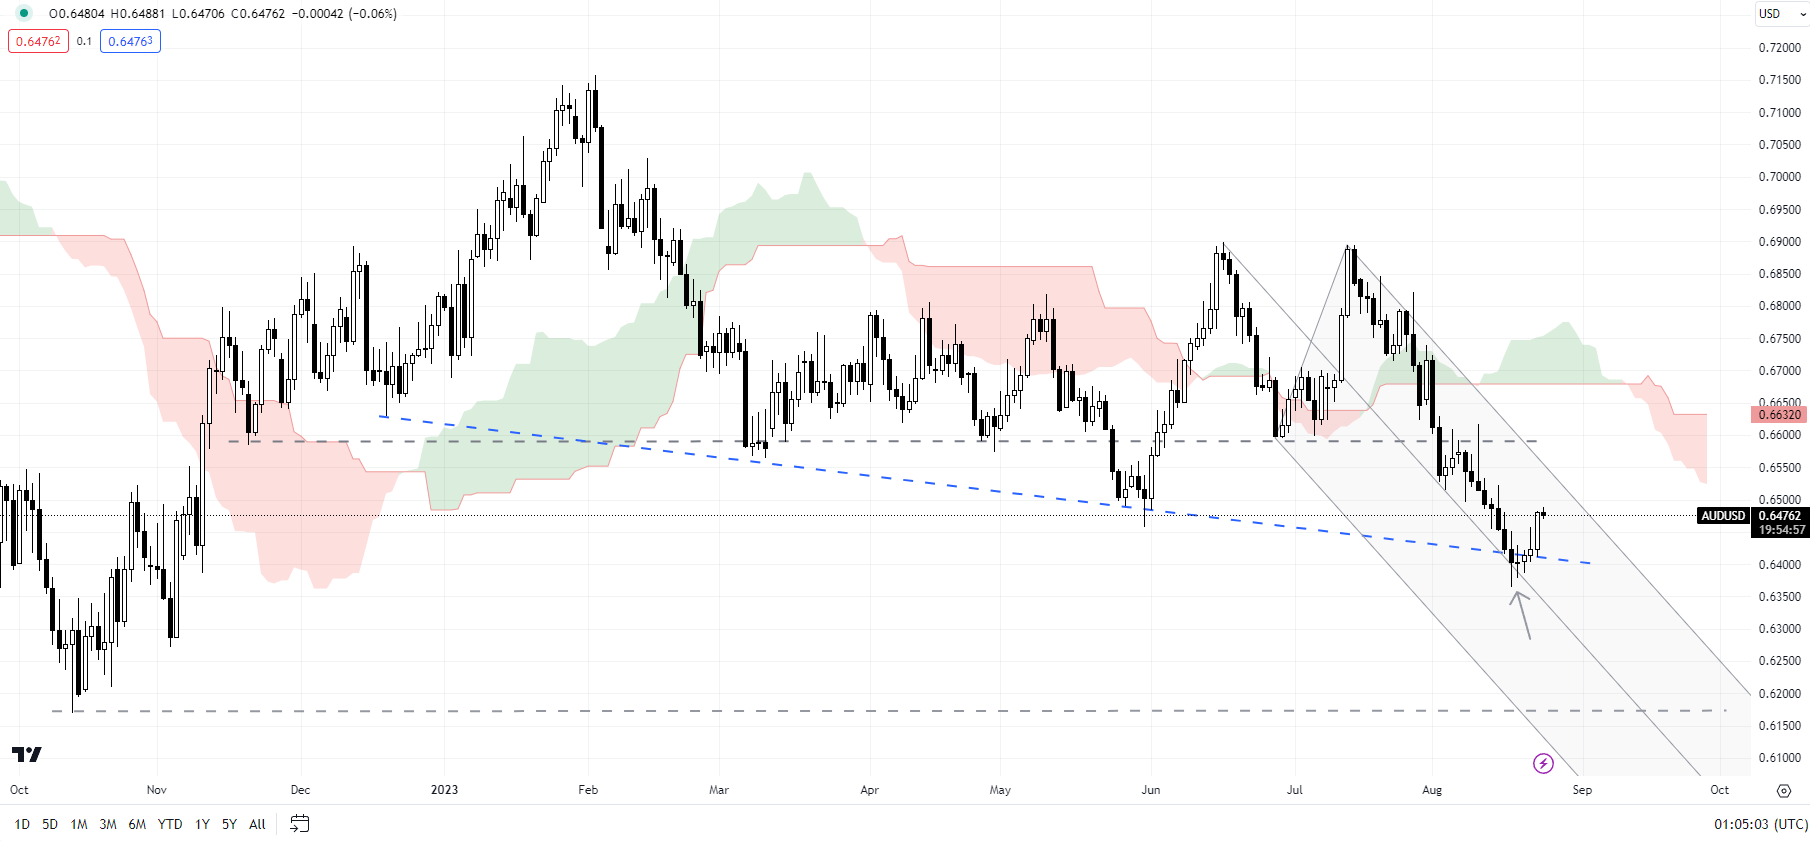
Chart Created by Manish Jaradi Using TradingView
AUD/USD: At vital converged support
AUD/USD looks deeply oversold as it tests a vital converged support on the median line of a declining pitchfork channel since June and a downtrend line from the end of 2023. The rise on Wednesday above minor resistance at Tuesday’s high of 0.6450 could be an early sign of a potential turnaround in AUD/USD. A cross above the 89-period moving average and the upper edge of the Ichimoku cloud on the 240-minute charts would be confirmation that AUD/USD had formed a base in the interim.

--- Written by Manish Jaradi, Strategist for DailyFX.com
--- Contact and follow Jaradi on Twitter: @JaradiManish