


DXY, EUR/USD – US Dollar Fourth Quarter Technical Forecast:
- US Dollar clocks in a consistent winning streak in Q3
- Potential Golden Cross eyed on the DXY weekly chart
- Meanwhile, EUR/USD faces Rising Wedge implications

DXY Dollar Index
The US Dollar clocked in a gain for the third quarter of 2023. On the weekly timeframe below is the DXY Dollar Index. A key takeaway is that the Greenback delivered at least 9 consecutive weeks of wins. You would have to go back to 2014 to see the same kind of consistent performance. How does this set up the currency for the fourth quarter of 2023?
One thing that could be interesting to keep an eye on in this timeframe is the potential for a bullish Golden Cross between the 20- and 50-week Simple Moving Averages (SMAs). Gains in the third quarter have set the stage for this potential formation. Confirming it could open the door to a broader bullish technical bias in the period ahead.
That may subsequently extend a push towards the 38.2 percent Fibonacci extension level at 109.35. Just above that is the midpoint at 112.37 before last year’s high of 114.77 kicks in. Otherwise, a turn lower and drop through the moving averages places the focus on the current 2023 low of 99.58. Clearing the latter would open the door to a stronger bearish technical conviction.
US Dollar Weekly Chart
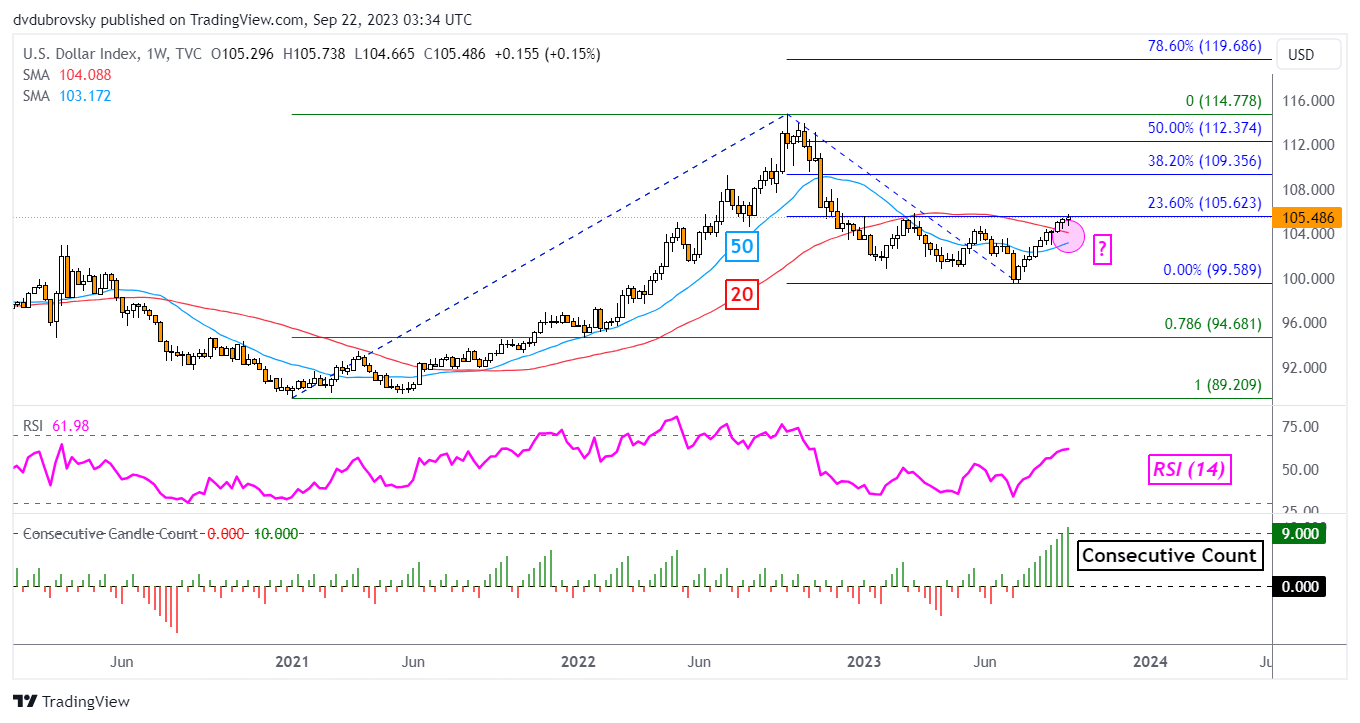
Chart Created in TradingView
EUR/USD
Focusing on the Euro, things are also looking very interesting. The single currency delivered at least 9 consecutive weeks of losses, making the longest losing streak since 1997. This followed a breakout under a bearish Rising Wedge chart formation on the weekly chart below. This is offering a downward technical bias for the fourth quarter.
The broader implications of the Rising Wedge breakout could open the door for EUR/USD to make its way to revisit last year’s low of 0.9535, or below parity to the US Dollar. Clearing the 23.6% Fibonacci extension level of 1.06118 exposes the 38.2% point at 1.0201. Otherwise, turning higher places the focus on the July high of 1.1275. Clearing the latter offers a stronger bullish bias towards 1.1494, which is the February peak.

Euro Weekly Chart
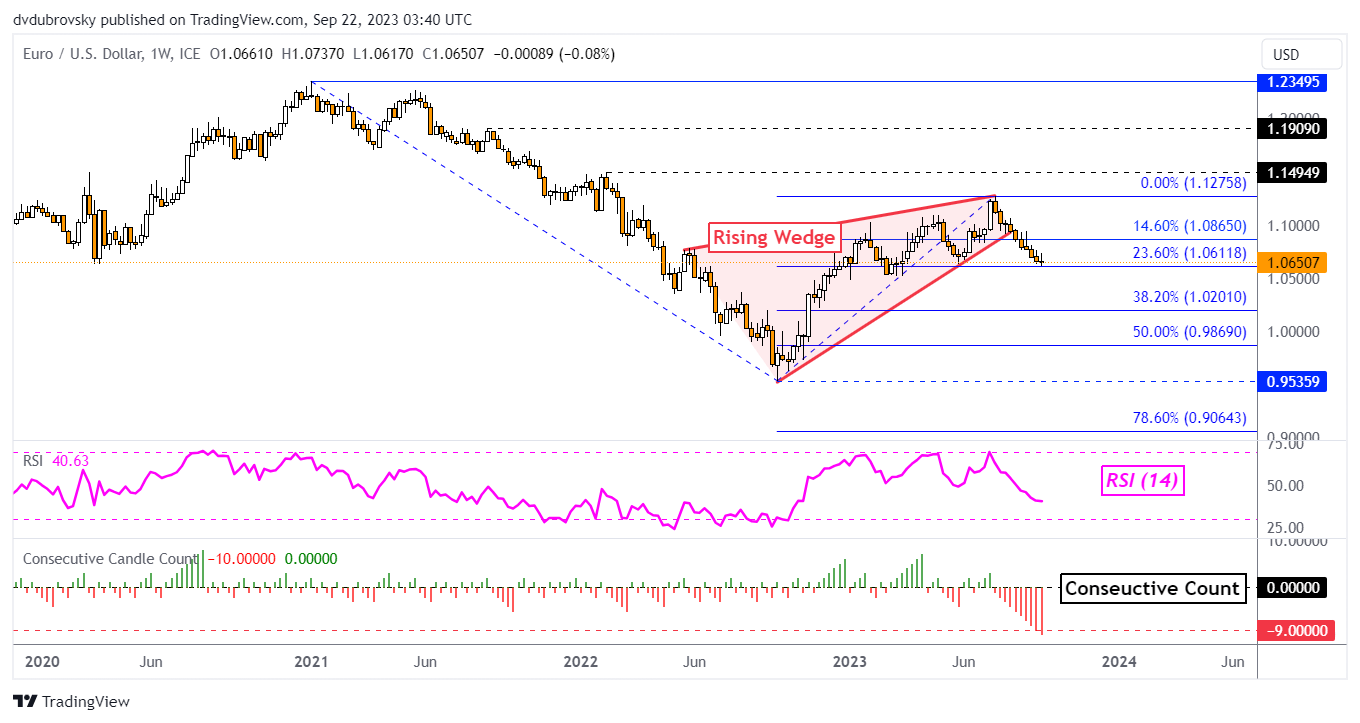
Chart Created in TradingView
--- Written by Daniel Dubrovsky, Contributing Senior Strategist for DailyFX.com


