
S&P 500 AND NASDAQ 100 OUTLOOK
- The S&P 500 and Nasdaq 100 finished the week higher, as the July FOMC decision brought calm to markets
- Attention now turns to Apple and Amazon’s earnings, two of the largest companies in the world
- Next Friday, however, the June U.S. jobs report will steal the limelight
Trade Smarter - Sign up for the DailyFX Newsletter
Receive timely and compelling market commentary from the DailyFX team
Most Read: Fed Hikes Rates After Short Pause, Gold and US Dollar Forge Separate Paths
Both the S&P 500 and Nasdaq 100 rallied this past week, inching ever closer to recapturing their 2023 highs. The ongoing earnings season has played a pivotal role in this impressive feat, instilling renewed confidence among investors that Corporate America has weathered a tough macro climate without major damage to quarterly profits.
The July FOMC decision also appeared to have boosted sentiment. While the Fed resumed its hiking campaign and raised rates to the highest level in 22 years, forward-guidance wasn’t perceived as hawkish, with Chairman Powell embracing a data-dependent stance and refraining from committing to additional policy firming. This approach led to some speculation that the normalization cycle has ended.
Recent economic data added to the prevailing upbeat mood. Second-quarter gross domestic product, initial jobless claims, consumer confidence and durable goods orders all surprised positively, aligning with the envisioned soft-landing scenario and giving traders hope that the Federal Reserve will be able to bring down inflation without triggering a significant downturn.
For sentiment to remain optimistic and to justify premium valuations, companies must continue to deliver favorable results in the current reporting period. That said, the highlight of the week ahead will be reports from mega-cap Apple and Amazon on Thursday, two of the five firms with the largest weighting in the S&P 500 and Nasdaq 100 and therefore very important in setting the tone on Wall Street.
AAPL is forecast to post EPS of $1.19 on revenue of $81.73 billion. Meanwhile, AMZN is seen earning $0.35 per share on sales of $131.46 billion. Given both companies' strong connection to consumers, it is vital to watch their remarks on household spending patterns. Positive commentary could be bullish for the market, while any negative feedback might heighten concerns about the overall outlook.

Check out DailyFX’s earnings calendar for a more complete list of the top companies announcing their financial performance in the coming days.
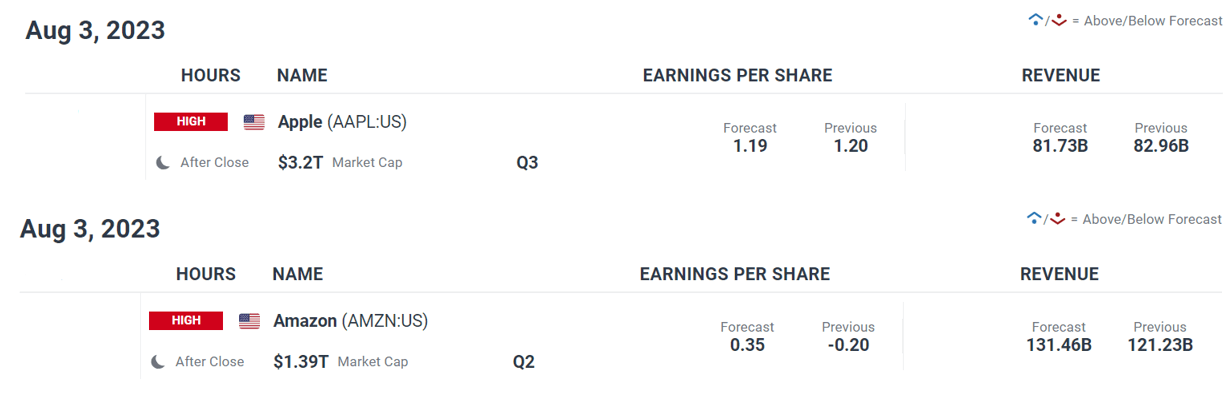
Source: DailyFX Earnings Calendar
On Friday, all eyes will turn to the U.S job report for this month. The economy is expected to show employers hired 200,000 workers in July, after adding 205,000 payrolls in June. Meanwhile, projections indicate that the unemployment rate will remain steady at 3.6%.
For investors, any headline print that aligns closely with the consensus estimate is likely to have a bullish effect on S&P 500 and Nasdaq 100, but a large deviation on the downside, such as job figures below 100,000, could have negative implications on risk assets by rekindling recession fears.
Conversely, a very strong NFP report could pose a different set of challenges. For instance, a print above 275,000 could exacerbate the imbalance between supply and demand for labor, raising fears of a wage spiral. This, in turn, might prompt traders to price in additional monetary tightening for 2023, leading potentially to a large equity market selloff.
| Change in | Longs | Shorts | OI |
| Daily | 6% | 1% | 3% |
| Weekly | -5% | -1% | -2% |
S&P 500 TECHNICAL ANALYSIS
After the recent rally, the S&P 500 has moved closer to the vicinity of a key technical resistance near 4,635, where this year’s peak aligns with the March 2022 highs and the upper boundary of a short-term rising channel. If buyers manage to push prices above ceiling, upside impetus could gather pace, setting the stage for a possible retest of the all time highs.
On the flip side, if sellers regain control of the market and trigger a bearish reversal, initial support appears at 4,555, followed by 4,500. On further weakness, we could see a pullback towards 4,415.
S&P 500 TECHNICAL CHART
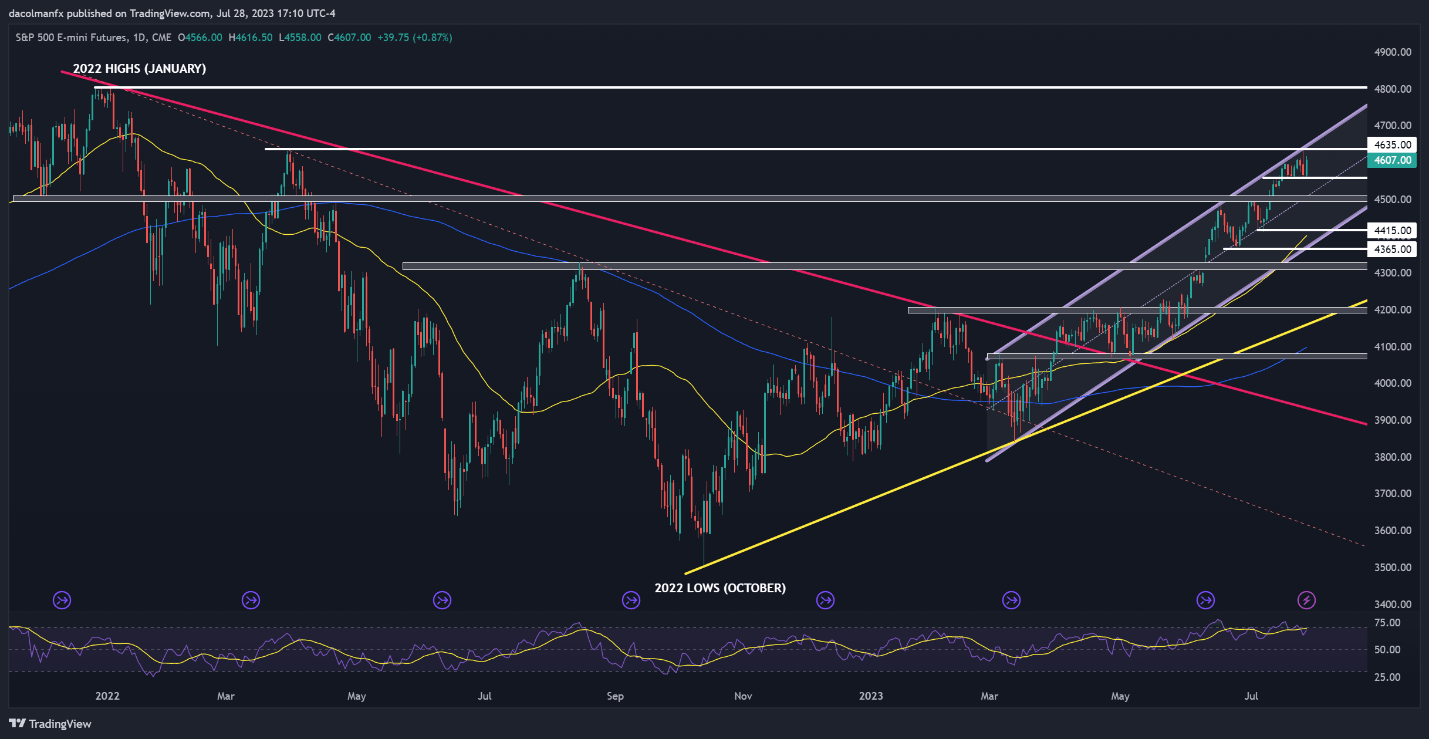
S&P 500 Futures Chart Created Using TradingView

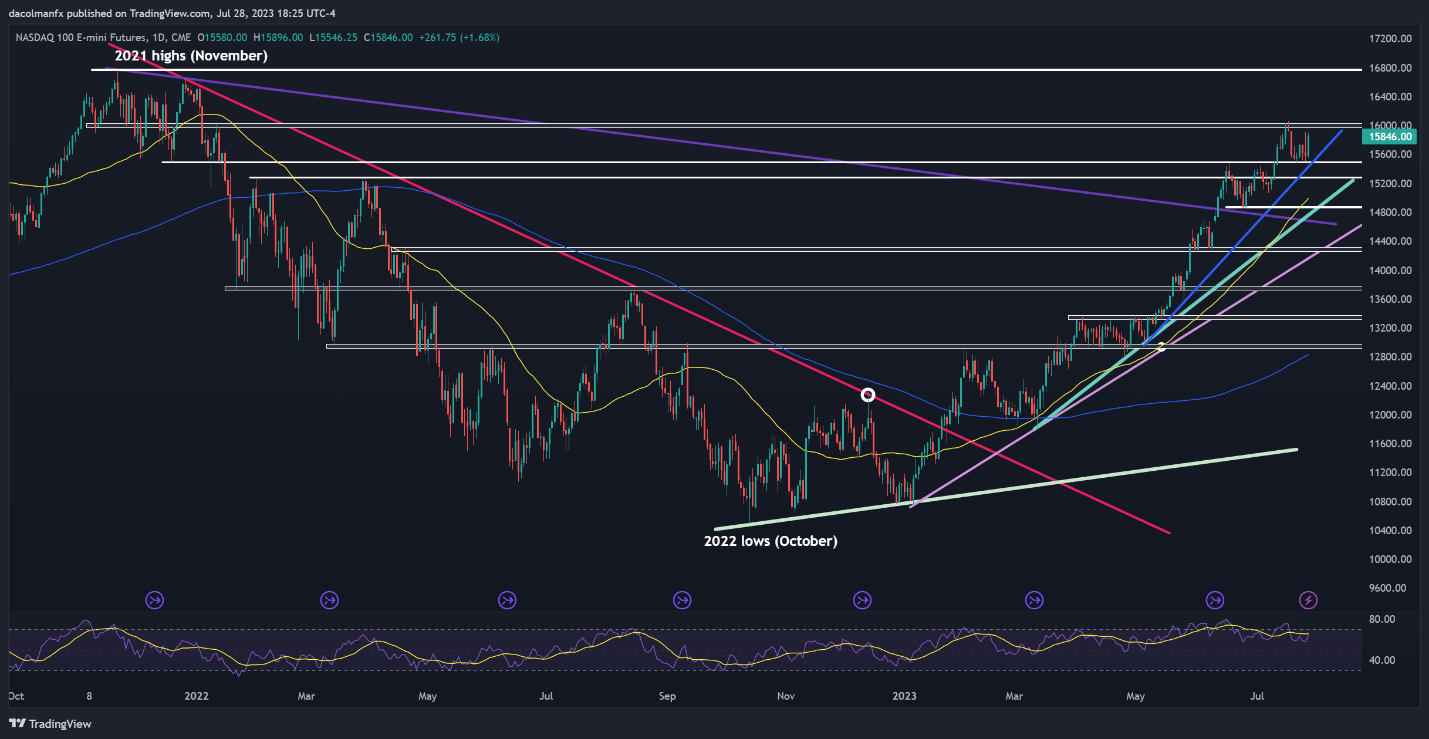
NASDAQ 100 TECHNICAL ANALYSIS
Earlier in the week, the Nasdaq 100 retreated, but manage to hold above support at 15,500, before rebounding aggressively heading into the weekend. After Friday’s move, the tech index is steadily approaching an important resistance around the psychological 16,000 level. Buyers may have a hard time driving prices above this barrier, but in the event of a breakout, the bulls may get the necessary momentum to mount an offensive aimed at reclaiming the 2022 highs.
In contrast, if prices pivot lower and begin to decline, the first support to consider rests at 15,500 and 15,275 thereafter. If these levels are taken out, we could see a drop toward 14,865.
NASDAQ 100 TECHNICAL CHART