


XAU/USD, S&P 500 PRICE FORECAST:
- Gold (XAU/USD) Prints Fresh Lows as US Yields Surge with the 10Y Hitting New Highs.
- Dollar Index (DXY) Advance Continued as Well Running into Resistance Just Shy of the 107.00 Handle. Is There an End in Sight for the DXY Rally?
- SPX Posted a Late recovery and Looks on Course for a Doji Close. Will this Translate into a Continued Recovery Tomorrow?
- To Learn More About Price Action, Chart Patterns and Moving Averages, Check out the DailyFX Education Section.
MOST READ: Japanese Yen Outlook: USD/JPY, EUR/JPY Analyzed Post BoJ Minutes Release
Download your Free Guide for Beginner Traders Now

Global markets continued to feel the pinch today extending losses in the early part of the US session as US Yields continued to advance alongside the US Dollar. Gold was no different slipping below the $1900 mark with gusto as it breezed past recent lows around $1884 to print a session low of $1872 at the time of writing.
US DOLLAR INDEX (DXY) AND AUTO WORKERS STRIKE
The US Dollar index hit fresh highs today before running into resistance around the 106.80 mark. This coincided with a slight bounce in both Gold and the SPX as the US session approached its end. Whether this will be a sustainable bounce however continues to look unlikely as any short-term bounce is likely to be met by selling pressure.
Hawkish comments from Fed policymaker Harker today did little to help ease the higher for longer narrative. Harker stated that current data does not suggest the Fed are at restrictive policy while hinting at further hikes should the Fed not achieve its objectives. This continued the hawkish rhetoric from Fed policymakers following last week’s Central Bank meeting.
The US is also dealing with United Auto Workers strike with plans to strike at an additional 3 automotive plants in Detroit on Friday if progress does not materialize. The UAW is expected to continue with walkouts unless a new contract is ratified and confirmed with this likely to weigh n the US economy.
There is a lot to concern market participants as Q4 approaches with US consumers likely to come under pressure. A depletion of savings coupled with a restart of the student debt repayments as well as higher oil prices, this is turning into a perfect cocktail which could actually help the Fed quell demand and tip inflation closer to target.
US 2Y and 10Y Yield Chart
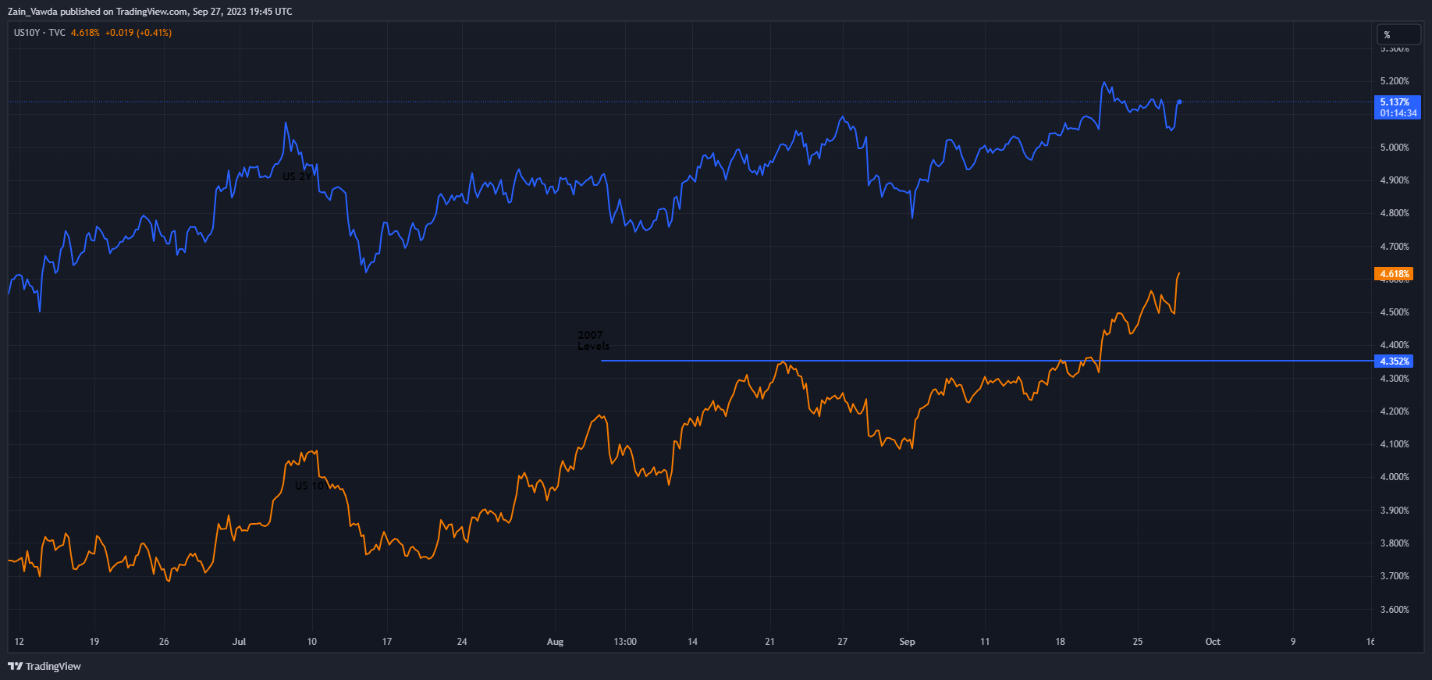
Source: TradingView, Created by Zain Vawda
US Yields and in particular the 10Y enjoyed a very productive Wednesday printing fresh highs around 4.62%. This was a surprise as this morning it appeared US Yields may be in for some pullback as the 10Y traded briefly below 4.5% mark before embarking on a bullish rally to fresh highs.

GOLD TECHNICAL OUTLOOK
Form a technical perspective, Gold prices recorded its worst day since July, falling around $30 on the day. As discussed yesterday we have now seen a follow through on the death cross pattern as the 50-day MA crossed below the 200-day MA, a sign of the bearish momentum in play.
Looking toward the downside and immediate support is provided by the daily low of $1872 handle. A break of the daily low leaves’ gold vulnerable to a drop toward the $1850s region with $1858 likely to provide some support.
Now it is key to note that we could get a short-term retracement here having printed a new lower low, and with the RSI now in oversold territory a pullback cannot be ruled out. This will depend on the pullback in the Dollar Index and US Yields but any such attempts at a pullback is likely to be met by selling pressure.
Gold (XAU/USD) Daily Chart – September 27, 2023
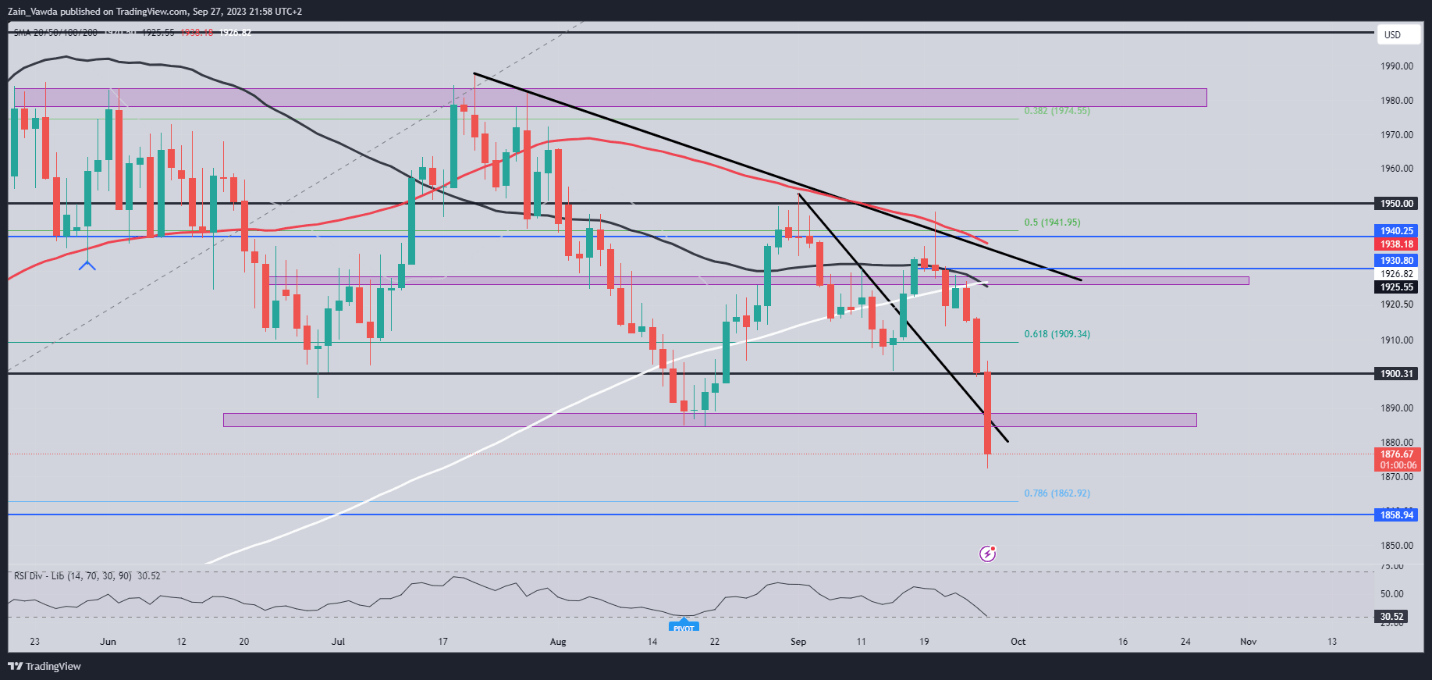
Source: TradingView, Chart Prepared by Zain Vawda
S&P 500 TECHNICAL OUTLOOK
The S&P 500 has been on a steep decline since touching the top of the triangle pattern on September 14, with a bearish engulfing candle hinting at what was to come. However, very few market participants expected the decline that followed given the resilience of US equities in 2023.
Having broken below the triangle pattern the 100-day MA provided little support with the 4300-level holding up the selloff briefly. Yesterday however saw the selloff resume leaving the SPX in no mans land between the 100 and 200-day MA. The daily candle has recovered to trade as a hammer briefly but given the headwinds facing markets at the moment a sustained recovery appears unlikely.
S&P 500 Daily Chart – September 27, 2023
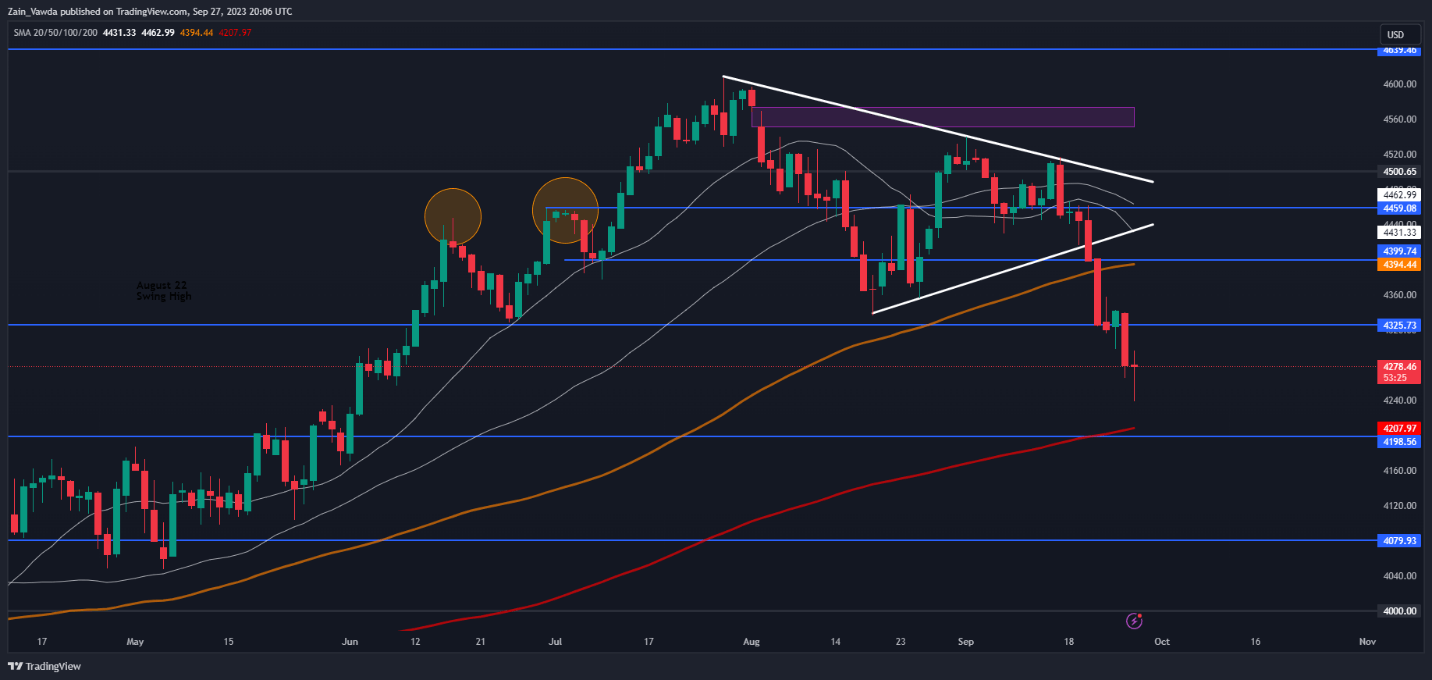
Source: TradingView, Chart Prepared by Zain Vawda
IG CLIENT SENTIMENT
Taking a quick look at the IG Client Sentiment, Retail Traders have shifted to a more bullish stance with 57% of retail traders now holding long positions. Given the Contrarian View to Crowd Sentiment Adopted Here at DailyFX, is this a sign that the SPX may continue to fall?
For a more in-depth look at Client Sentiment on the SPX and how to use it download your free guide below.
| Change in | Longs | Shorts | OI |
| Daily | 10% | 6% | 8% |
| Weekly | -5% | 7% | 1% |
Written by: Zain Vawda, Markets Writer for DailyFX.com
Contact and follow Zain on Twitter: @zvawda


