S&P 500 and Nasdaq 100 – Fundamental Forecasts and Analysis
- Tech earnings go into overdrive as Apple, Amazon, and Meta all release their latest figures.
- FOMC meeting and non-farm payrolls are the picks of the US high-risk events.
- S&P 500 finally breaks its multi-month bear trend.

US equity markets are girding themselves for a week packed full of high-importance data, events, and earnings releases which may well dictate the market’s future over the coming week. To pick out just a handful of ‘must watch’ events there is the FOMC rate decision (a 25bp hike is fully expected and priced-in) and the post-decision press conference, the latest US Jobs Report (NFPs), and quarterly earnings releases from a host of mega-cap tech stocks.
For all market-moving events and data releases, see the real-time DailyFX Economic Calendar
Next week’s US earnings calendar is filled with heavyweight tech companies reporting their latest numbers including Apple, Alphabet, Amazon, and Meta, while General Motors, Pfizer, Ford, and Spotify, and a host of other household names also open their books. We have seen some sharp post-earnings moves this week from companies as diverse as Intel and Tesla and it is highly likely that we will see more volatility next week.
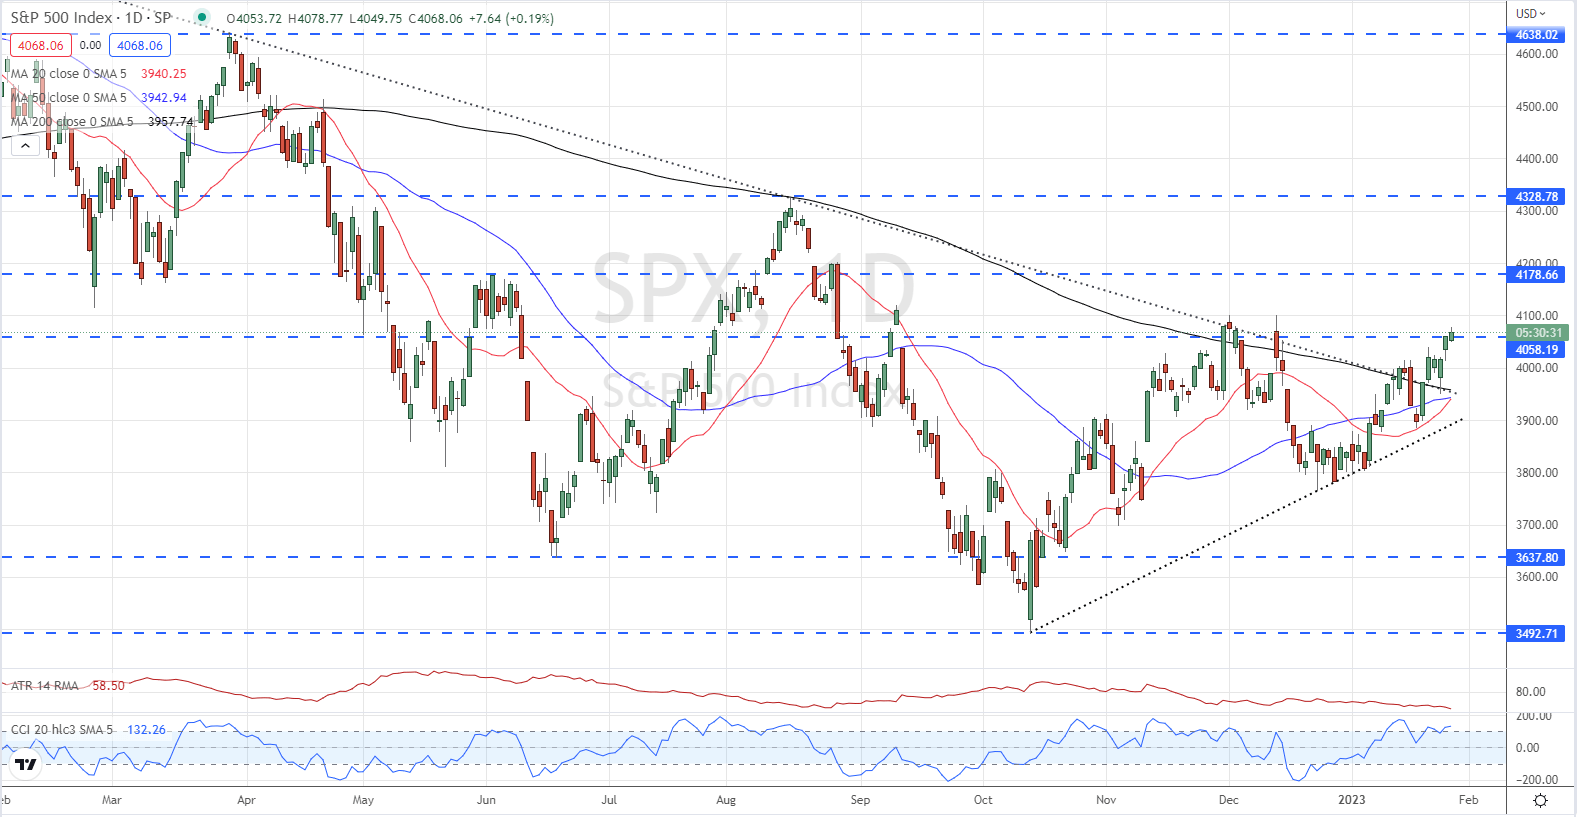
The S&P 500 is looking like it is finally breaking the shackles of the dominant downtrend, and the 200-day moving average, that has been in control of price action for the last year. The recent close and open above the trendline indicated that the S&P is set to push higher but caution is needed due to all of next week’s events and releases. If the S&P can weather any potential bearish storm over the next days, then resistance around 4,100, then 4,178, and then 4328 may come back into play.
S&P 500 Price Chart – January 27, 2023
S&P Retail Sentiment is Bullish
| Change in | Longs | Shorts | OI |
| Daily | -11% | 8% | -1% |
| Weekly | -6% | 8% | 2% |
Retail Trader data show 42.11% of traders are net-long with the ratio of traders short to long at 1.38 to 1.The number of traders net-long is 1.58% lower than yesterday and 19.32% lower from last week, while the number of traders net-short is 5.65% higher than yesterday and 18.88% higher from last week.
We typically take a contrarian view to crowd sentiment, and the fact traders are net-short suggests US 500 prices may continue to rise. Traders are further net-short than yesterday and last week, and the combination of current sentiment and recent changes gives us a stronger US 500-bullish contrarian trading bias.
What is Earnings Season and What to Look for in Earnings Reports?
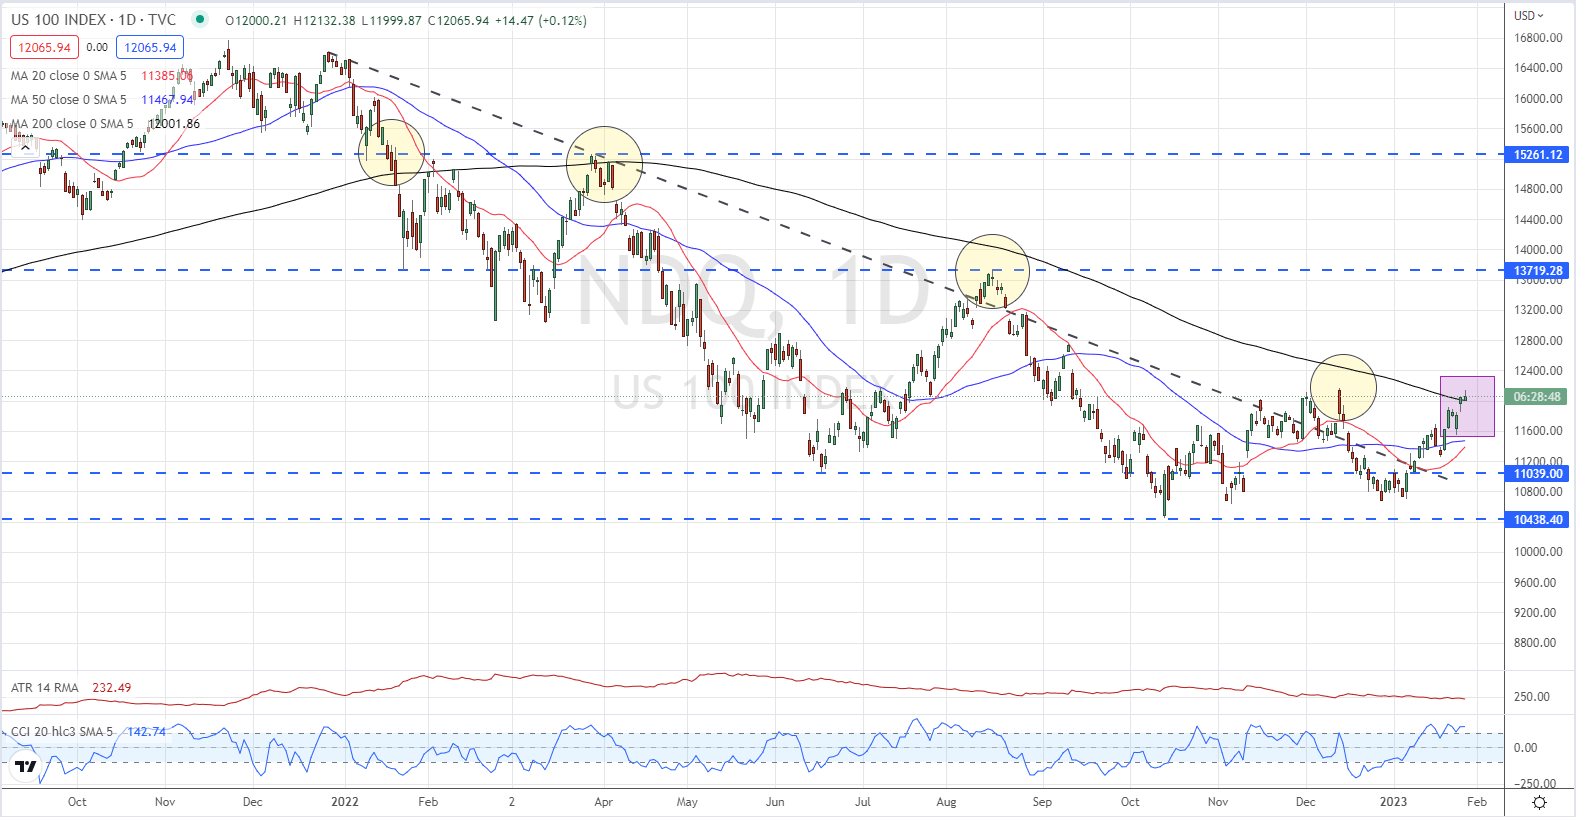
The Nasdaq 100 has also broken its controlling downtrend but is currently battling with the 200-day moving average, an indicator that has not only held back the tech-laden indices but has also prompted a sharp downturn. With a host of heavyweight techs reporting next week – Apple has an 11.8% Nasdaq weighting, while Amazon has a 6.5% weighting – earnings are paramount next week.
Nasdaq 100 Daily Price Chart – January 27, 2023
What is your view on the S&P 500 and the Nasdaq 100 – bullish or bearish?? You can let us know via the form at the end of this piece or you can contact the author via Twitter @nickcawley1.