


Brent Crude, WTI Oil News and Analysis
- Announcement of extended production cuts reignites bullish momentum
- Bullish catalyst attracts lofty price targets for Brent and WTI
- Overheating concerns appear with the RSI entering overbought territory
- The analysis in this article makes use of chart patterns and key support and resistance levels. For more information visit our comprehensive education library

Announcement of Extended Production Cuts Reignite Bullish Momentum
Saudi Arabia and Russia announced that the oil production cuts, starting in July and extending into August and September, are to continue into the end of the year. The news sent already elevated oil markets even higher as the cuts exacerbate an already tight market.
The 5-minute chart below shows the markets immediate reaction to the three-month commitment as it had previously only committed one month in advance when it came to production cuts. Brent crude rose by around $1.38 in the first 5-minutes of the announcement, pulled back slightly and then caught another wave of upside momentum to around $91 at the time of writing.
Brent Crude Oil 5-Minute Chart
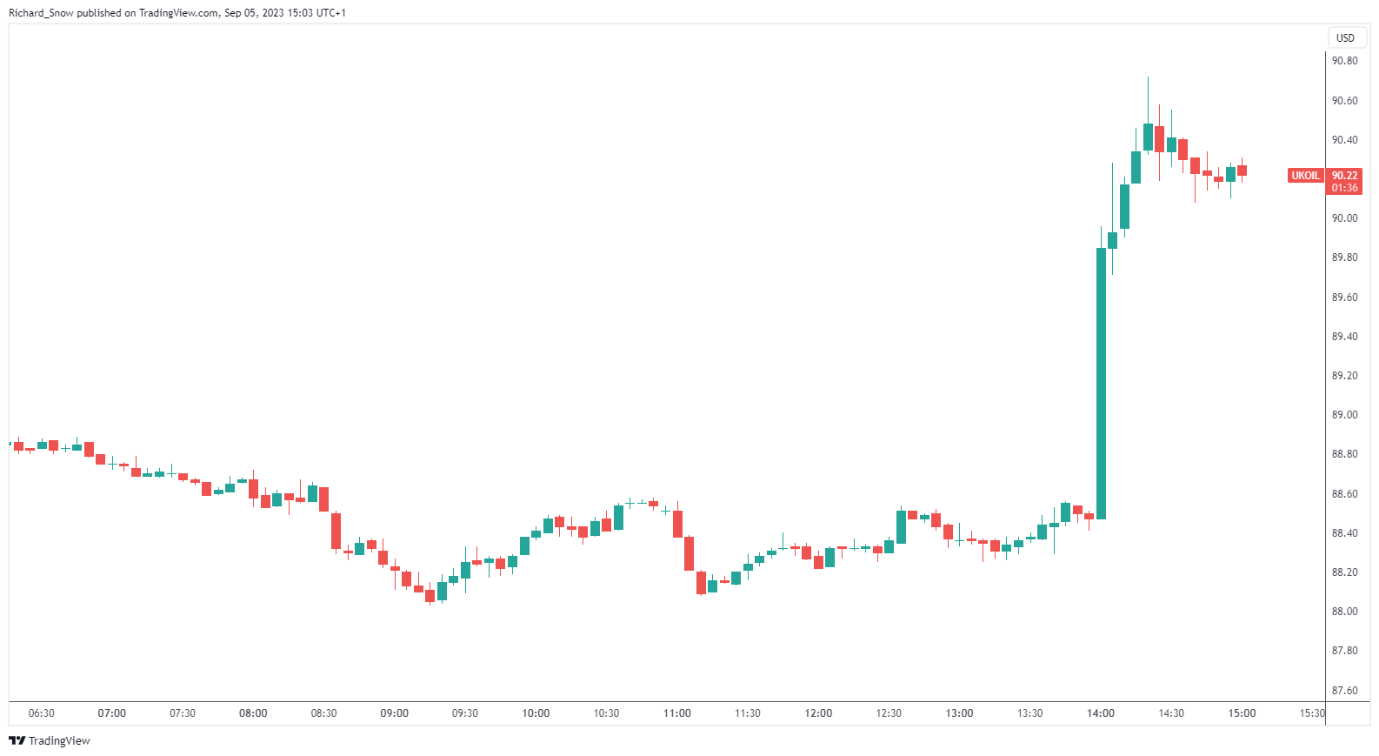
Source: TradingView, prepared by Richard Snow
Bullish Catalyst Attracts Lofty Price Targets
The bullish momentum surpassed $89 with ease and now eyes the 38.2% Fibonacci retracement of the major 2020-2022 rise at $91.42, followed by a potential move to $95.60. Ever since breaking above the 200-day simple moving average, oil has maintained the bullish run which began at the end of June.
The RSI provides a potential warning of a market that has become overheated in a very short space of time. The risk here is that once the market has fully digested the news, there may be a brief period where the oil price cool slightly and traders potentially opt to reduce long exposure. Support appears at $89 per barrel.
Brent Crude Daily Chart
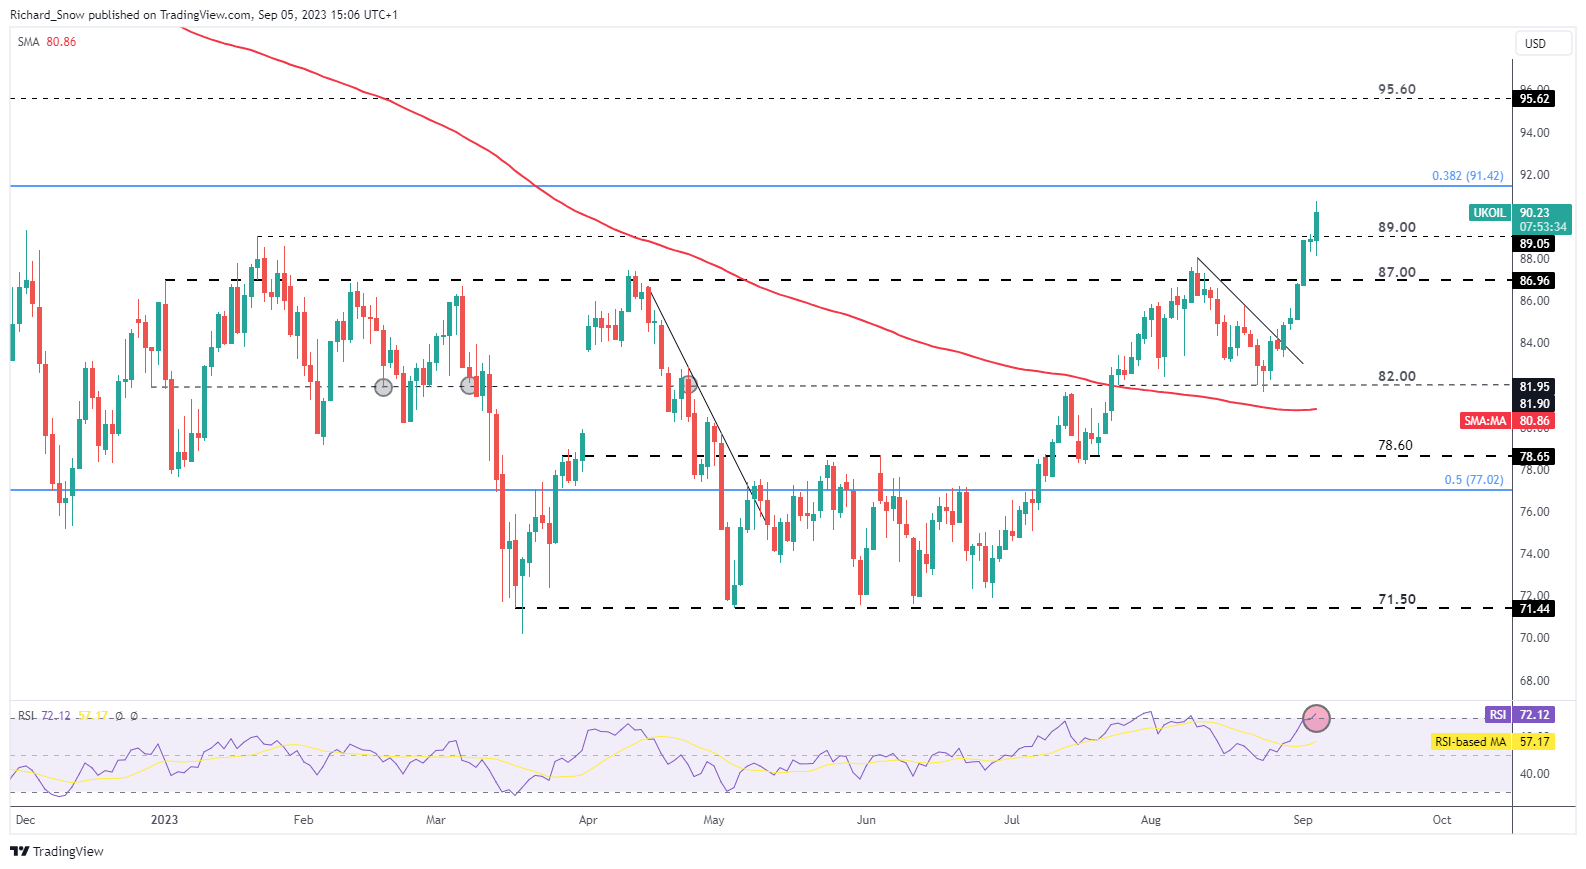
Source: TradingView, prepared by Richard Snow

WTI oil has responded in kind, rising just shy of $88 at the time of writing, just under 3% on the day. The latest bullish catalyst has WTI bulls eying $93 per barrel but just like with Brent crude, the RSI flashes a warning sign over a potential pullback. Support appears back at $82.50.
WTI Oil Daily Chart
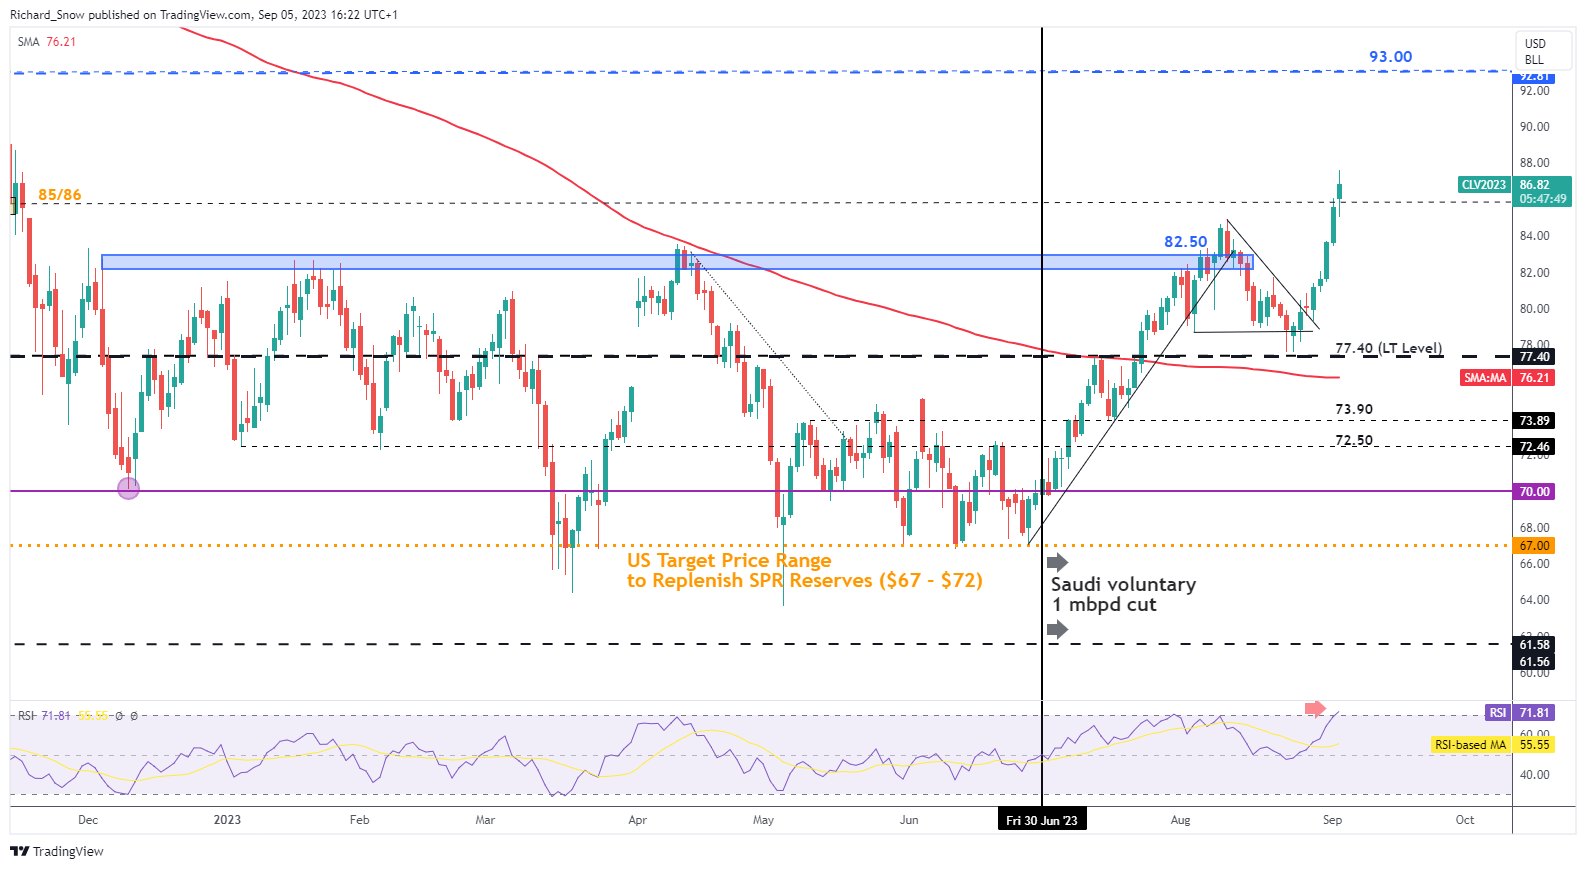
Source: TradingView, prepared by Richard Snow
| Change in | Longs | Shorts | OI |
| Daily | 0% | 3% | 0% |
| Weekly | -2% | 8% | 0% |
--- Written by Richard Snow for DailyFX.com
Contact and follow Richard on Twitter: @RichardSnowFX


