


Oil (WTI, Brent Crude) Analysis
- WTI oil finds support around significant long-term level, hinting at a reversal
- Brent crude oil turns just short of bridging the price gap created by OPEC’s surprise supply cut
- IG retail client sentiment turns ‘mixed’ as longs surge and shorts decline
- The analysis in this article makes use of chart patterns and key support and resistance levels. For more information visit our comprehensive education library

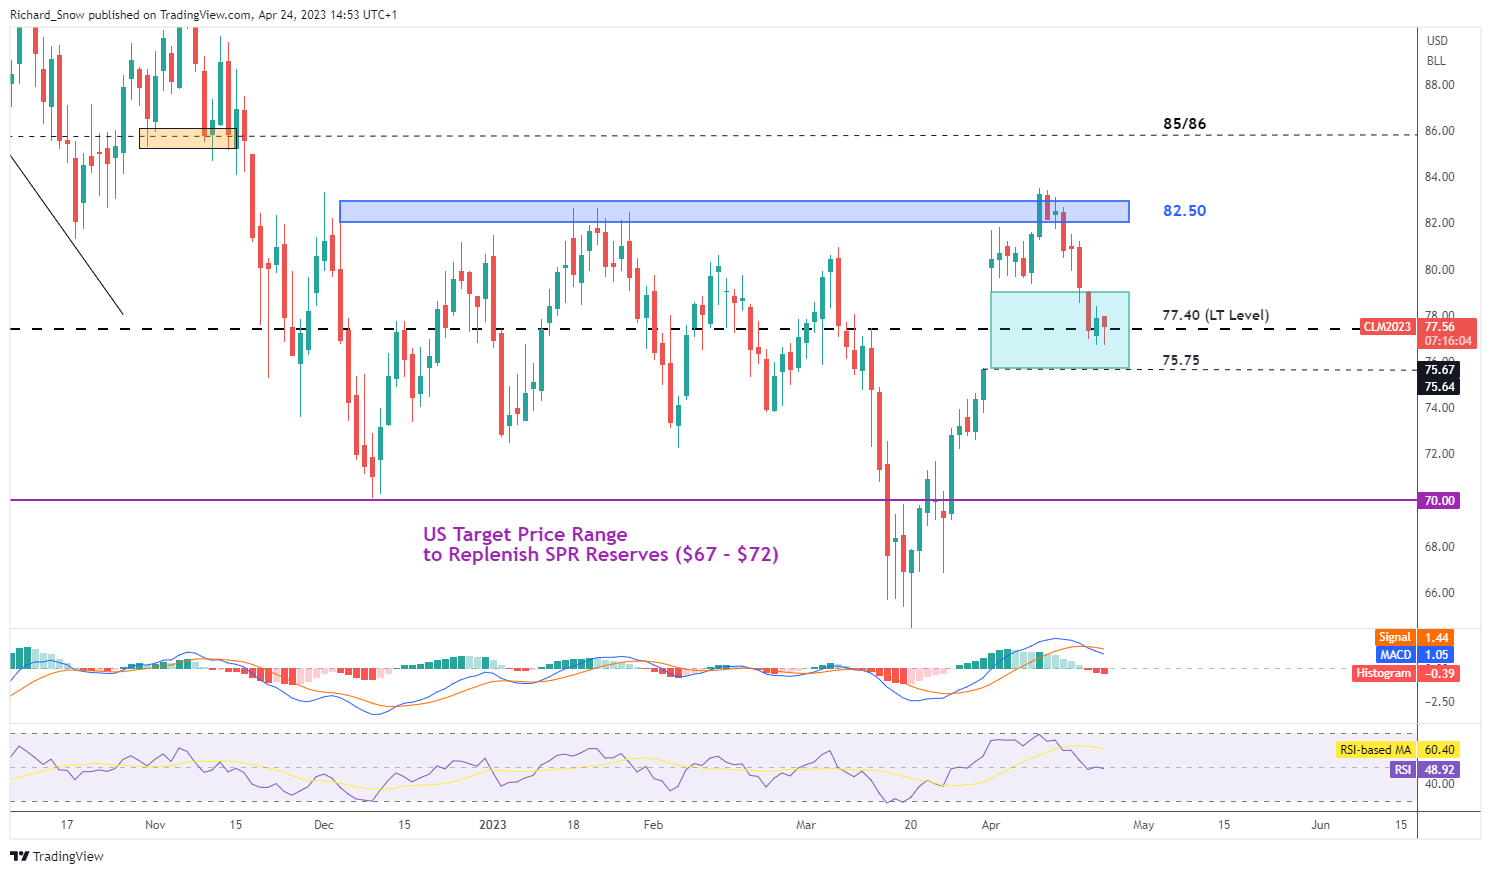
WTI Oil Finds Support Before Closing the Price Gap
Oil markets have mounted somewhat of a challenge to the latest selloff around the long-term level of $77.40. The signs of bearish fatigue ahead of the $75.75 level appears just short of technically completing a full retracement of the recent gap higher.
Subsequent candles showing a reluctance to trade lower (via the lower candle wicks) suggests that bears may be running out of momentum or require an additional catalyst to bridge the gap. The latest round of OPEC cuts come into force in May and markets are potentially more evenly balancing risks of a growth slowdown and reduced oil supply, balancing the market for now.
With $77.40 acting as immediate support, the next level of consideration in the event of a bearish continuation is $77.40. On the other hand, resistance appears around the $79.10 level followed by the $82.50 zone of resistance.
Oil (WTI) Daily Chart
Source: TradingView, prepared by Richard Snow
Brent crude oil has mounted a slight pullback after coming within a few ticks of achieving a full retracement of the price gap. The potential for a pullback is building after yesterday’s gains followed by a continued move in early US trading. Support appears around the zone of support at $79.89 and then the 50% retracement of the 2020-2022 major move at $77. Resistance remains all the way at $89 which appears a fair distance away.
Brent crude oil daily chart
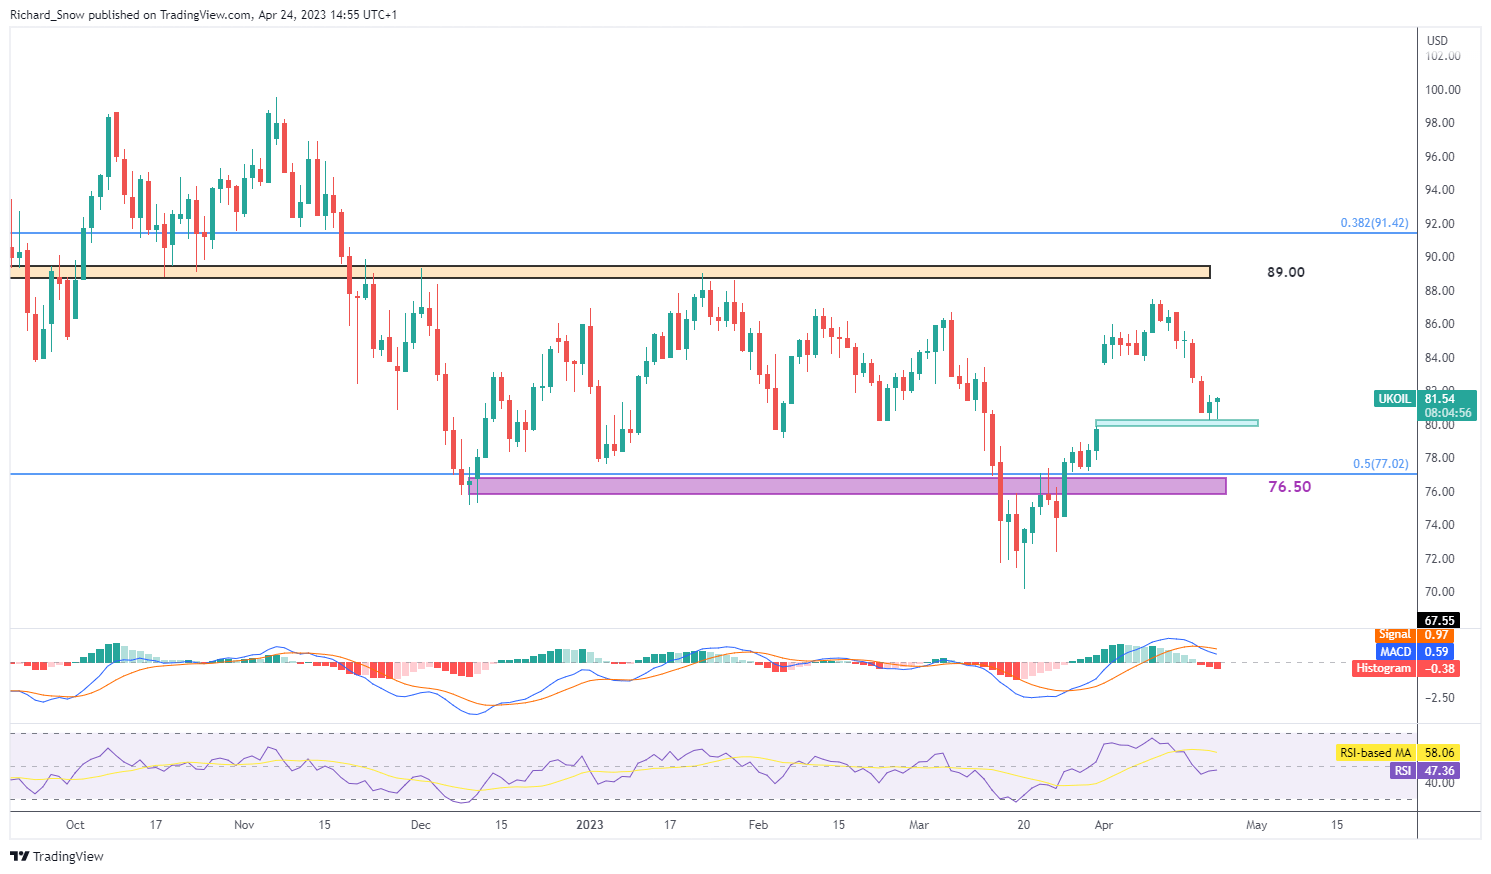
Source: TradingView, prepared by Richard Snow
Oil (WTI) Retail Sentiment Provides a Mixed Outlook as Long Positioning Surges
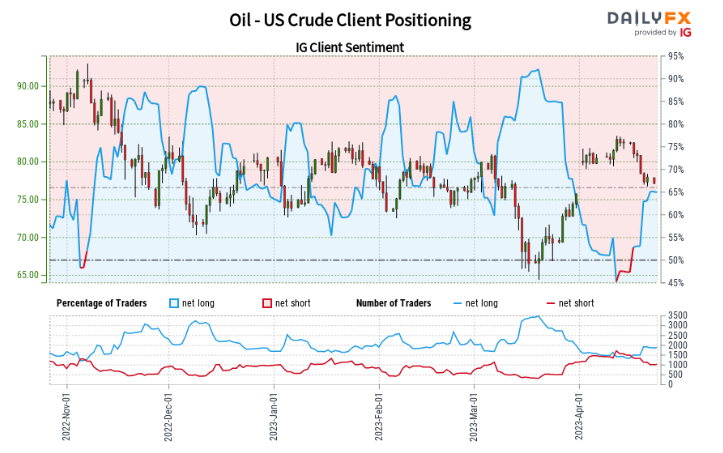
Oil- US Crude:Retail trader data shows 64.72% of traders are net-long with the ratio of traders long to short at 1.83 to 1.
We typically take a contrarian view to crowd sentiment, and the fact traders are net-long suggestsOil- US Crude prices may continue to fall.
The number of traders net-long is 3.42% higher than yesterday and 33.82% higher from last week, while the number of traders net-short is 3.94% higher than yesterday and 30.59% lower from last week.
Positioning is less net-long than yesterday but more net-long from last week. The combination of current sentiment and recent changes gives us a further mixed Oil - US Crude outlook.
Trade Smarter - Sign up for the DailyFX Newsletter
Stay up to date with the latest market moving developments
--- Written by Richard Snow for DailyFX.com
Contact and follow Richard on Twitter: @RichardSnowFX


