

Oil (Brent, WTI) News and Analysis
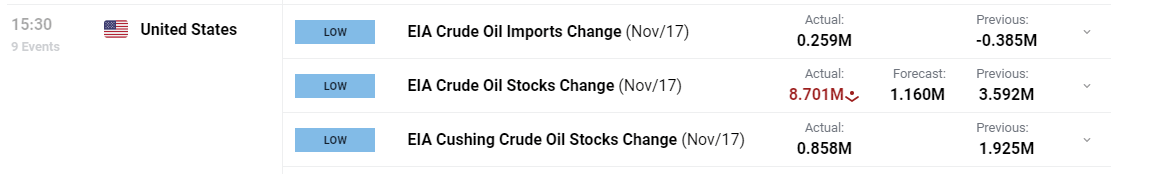
- EIA storage figures reveal increasing stock levels – keeping prices suppressed
- Brent crude pullback has proven to be short lived after failing to surpass 200 SMA
- WTI revealing a bearish formation (evening star) at notable level of resistance
- The analysis in this article makes use of chart patterns and key support and resistance levels. For more information visit our comprehensive education library
EIA Storage Figures Reveal Increasing Stock Levels – Keeping Prices Suppressed
Cushing storage levels revealed another sizeable build even after last week’s double dose of rising stock levels – helping continue the slide in oil prices.
Customize and filter live economic data via our DailyFX economic calendar
Oil prices have continued to drop ever since a notable turn in fundamental data in the US which itself, followed on from very weak data in Europe and China. The pessimistic economic outlook has led forward-looking markets to price in lower oil demand if the global economy is set to contract in the coming months and quarters.
OPEC and its allies known as OPEC + was scheduled to reconvene on Saturday amid rising speculation of extended supply cuts which typically results in rising oil prices. Breaking news confirms that the meeting has now been delayed to the 30th of November with analysts pointing to potentially differing views in the group as the reason for the delay but this is yet to be confirmed.
Today’s price action tested the crucial 200-day simple moving average (SMA) before heading lower. The 200 SMA roughly coincides with the $82 level – a prior pivot point for the commodity. The next level of support appears via the 50% Fibonacci retracement of the broader 2020 to 2022 move at $77 before the $71.50 level comes into focus. Resistance remains back at the 200 SMA.
Oil (Brent) Daily Chart
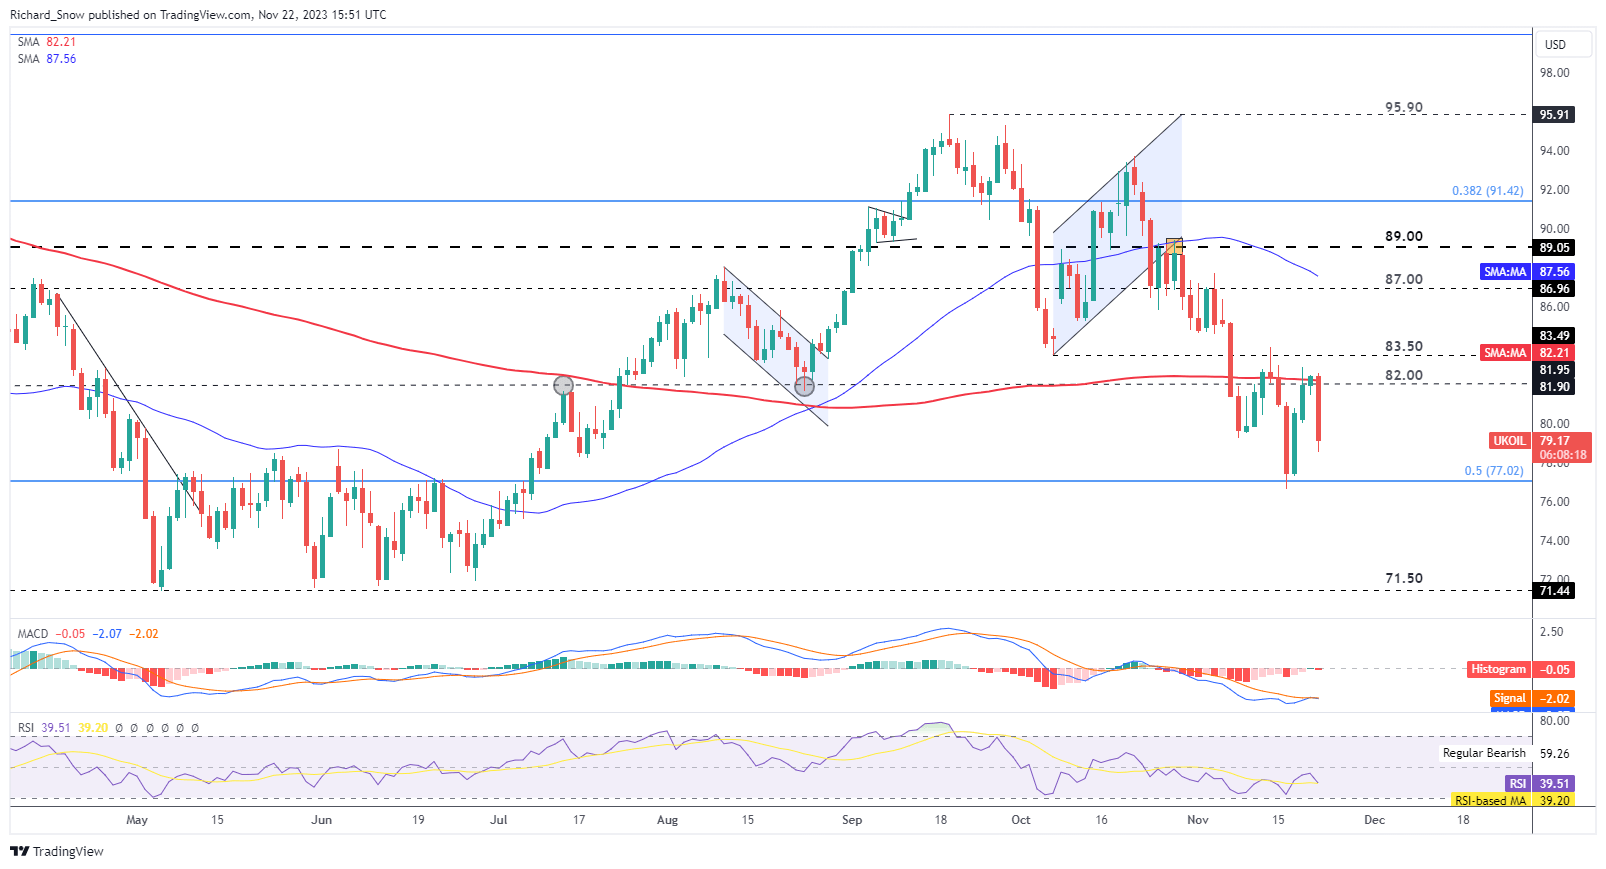
Source: TradingView, prepared by Richard Snow

The WTI chart highlights a similar dynamic, with the chart portraying the same rejection of the 200 SMA, just above the significant long-term level of $77.40 (see monthly chart further down). Support is at the prior swing low at $72.50, followed by $67 - which is the lower level identified by the Biden administration to replenish SPR storage, something that is now due to take years to complete.
The formation of an evening star adds to the bearish sentiment and even though it appears within a mature trend, revealed a notable rejection at the 200 SMA.
Oil (WTI) Daily Chart
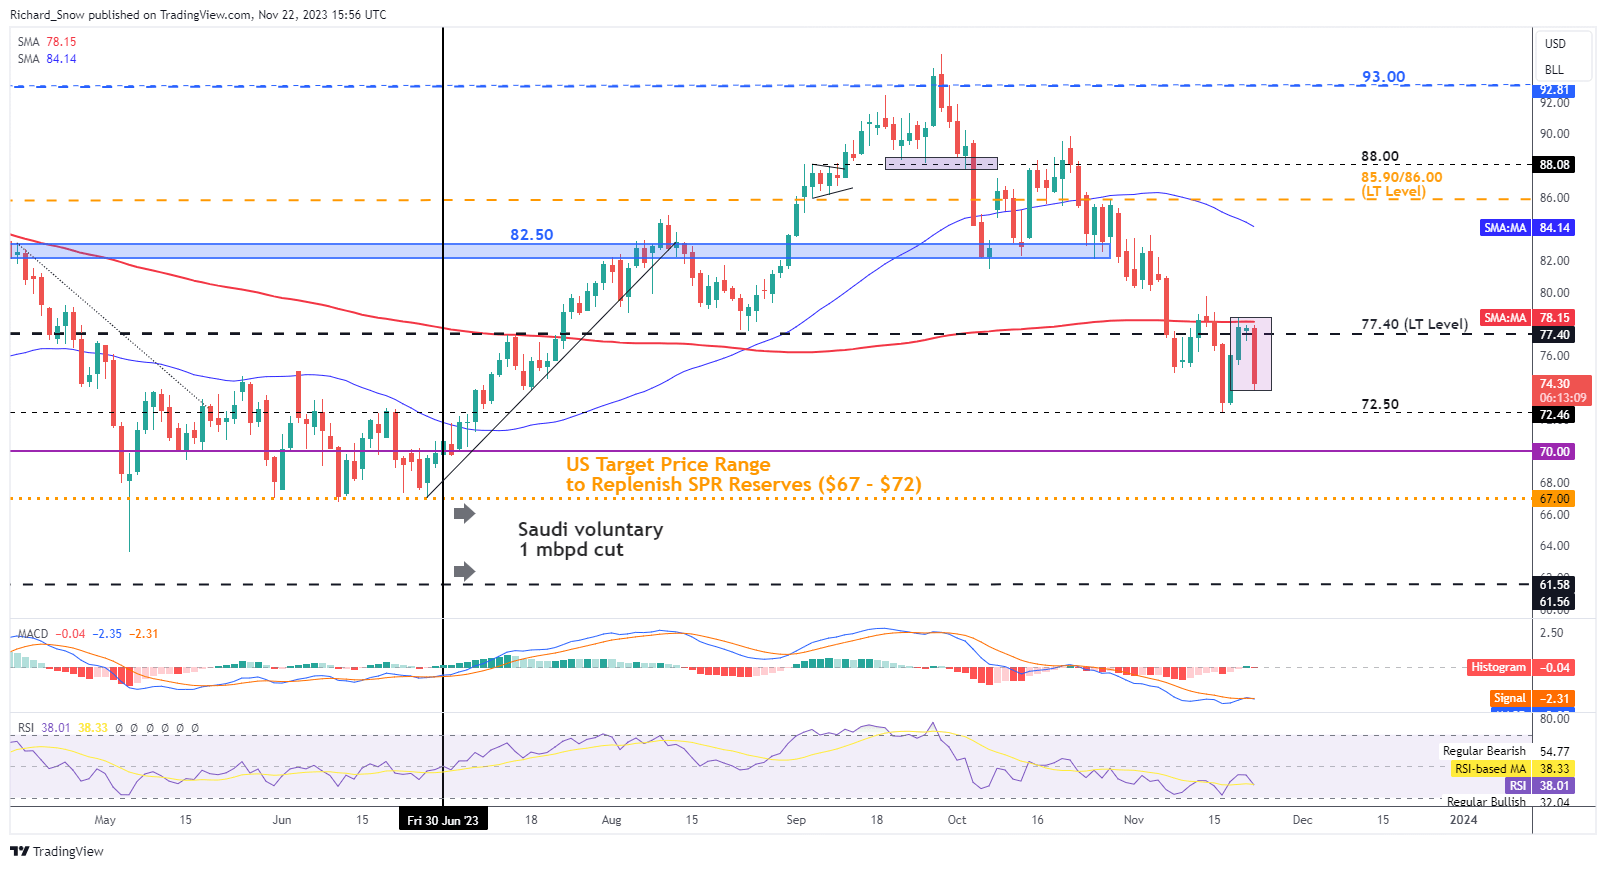
Source: TradingView, prepared by Richard Snow
| Change in | Longs | Shorts | OI |
| Daily | -1% | -10% | -4% |
| Weekly | 1% | -18% | -5% |
The monthly chart helps to isolate the significant long-term level of $77.40 – a level that has provided multiple major reversals/pivot points in the past.
Oil (WTI) Monthly Chart
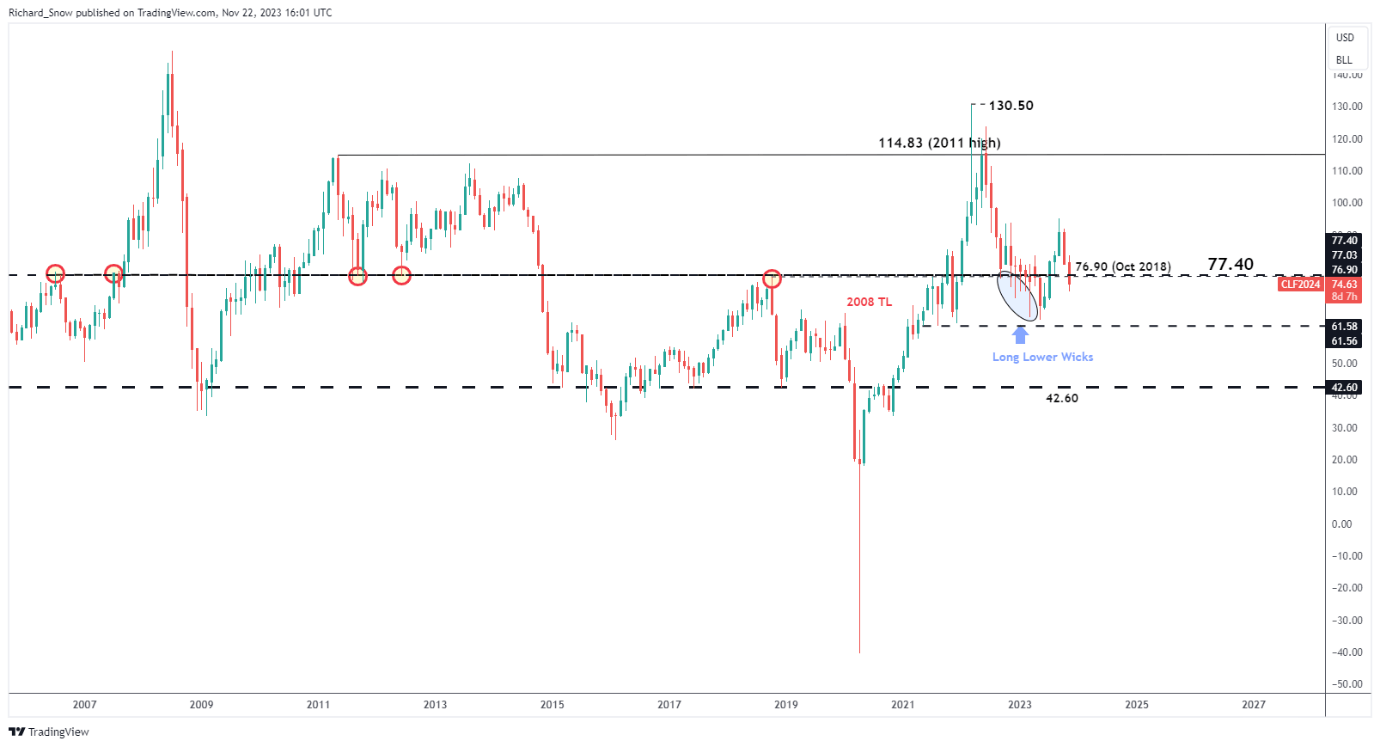
Source: TradingView, prepared by Richard Snow
--- Written by Richard Snow for DailyFX.com
Contact and follow Richard on Twitter: @RichardSnowFX