Article by IG Senior Market Analyst Axel Rudolph
FTSE 100, DAX 40, Nikkei 225, Analysis and Charts
FTSE 100 still tries to push ahead
Last week the FTSE 100 outperformed its European and US counterparts by ending the week up 0.2% and not in the red like the others as the index benefitted from the rise in oil and gas prices. The UK blue chip index is seen breaking through its July-to-September downtrend line at 7,485, attacking the early September high at 7,524. Further up the early July peak can be spotted at 7,532 ahead of the 200-day simple moving average (SMA) at 7,638.
Minor support can be seen along the 55-day simple moving average (SMA) at 7,475 and also at the 7,437 early August low as well as the 7,419 late August low.
FTSE 100 Daily Chart

Download the Free FTSE 100 Sentiment Guide
| Change in | Longs | Shorts | OI |
| Daily | 3% | -2% | -1% |
| Weekly | 48% | -4% | 3% |
DAX 40 to open up after dismal week
The DAX 40 dropped 1.2% last week as Euro Zone growth worries, a rising US dollar and yields pushed the index to a two-week low at 15,575 before stabilizing on Friday. While last week’s low at 15,575 holds on a daily chart closing basis, the 24 August high and July-to-September downtrend line at 15,895 may be revisited. This scenario would become more likely if today’s daily chart close were to be made above Friday’s 15,787 daily candlestick “Hammer” high which would trigger a bullish technical reversal signal. Slightly further up meanders the 55-day simple moving average (SMA) at 15,927.
Were last week’s low at 15,575 to fall through on a daily chart closing basis, though, the 200-day SMA and August low at 15,514 to 15,469 would be back in sight.
DAX 40 Daily Chart


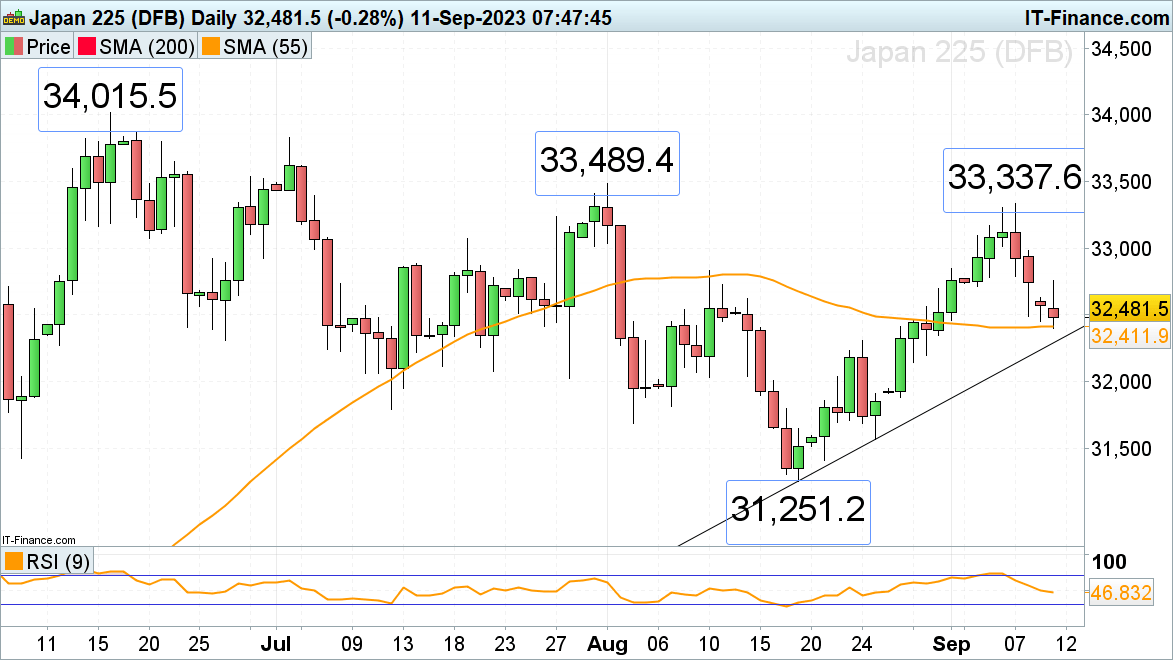
Nikkei 225 opens lower
Following last week’s slide in line with other major global stock indices on worsening sentiment, the Nikkei 225 also began this week on a weaker footing.The index dropped by half a percentage point as the governor of the Bank of Japan (BoJ) Kazuo Ueda signaled that the negative rates policy could be ended by the start of 2024 if wage inflation were to persist. The Nikkei 225 touched the 55-day simple moving average (SMA) at 32,411.9 which so far acted as interim support. Below it the August-to-September tentative uptrend line can be found at 32,294.0 which would be expected to hold, though.
A rise above Monday’s 32,759.0 intraday high is needed for at least a minor bottom to be formed.
Nikkei 225 Daily Chart