
| Change in | Longs | Shorts | OI |
| Daily | -4% | 0% | -1% |
| Weekly | -22% | 18% | 4% |
USD/JPY TECHNICAL ANALYSIS
USD/JPY rallied strongly in June on the assumption that the Federal Reserve would maintain a hawkish stance in the face of resilient U.S. economic activity. However, the pair has lost all of that advance this month on profit-taking. New data, which showed weaker-than-expected inflation, has reinforced the bearish correction, leading traders to reprice lower the Fed's hiking path.
From a technical standpoint, USD/JPY has fallen toward a key floor at 138.30 in recent days, corresponding to the 38.2% Fibonacci retracement of the January/June rally. The exchange rate has managed to hold up above this area this week, but it is struggling to move higher, a sign that sellers may still be in control of the market for now.
In the event prices resolve to the downside, breaching support at 138.30, bears could initiate an attack on the 200-day simple moving average at 137.00. On further weakness, we could see a move toward 134.10. In contrast, if buyers regain the upper hand and spark a rebound from current levels, initial resistance appears at 139.60, followed by 141.00.
USD/JPY TECHNICAL CHART
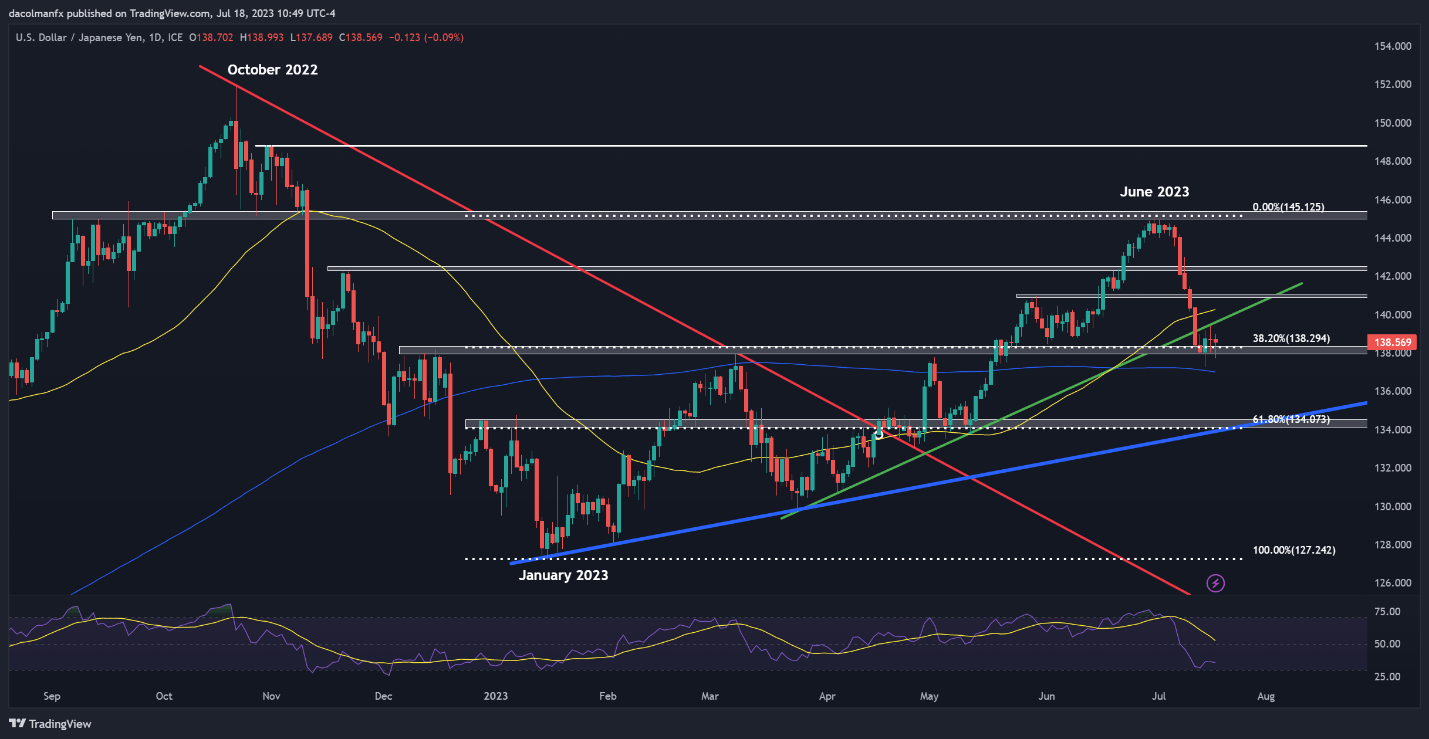
USD/JPY Chart Prepared Using TradingView
| Change in | Longs | Shorts | OI |
| Daily | 1% | 3% | 3% |
| Weekly | -25% | 36% | 18% |
EUR/JPY TECHNICAL ANALYSIS
EUR/JPY has also corrected to the downside in July, but its pullback has been less dramatic overall, especially after last week's rebound where prices staged a moderate turnaround after bouncing off medium-term trendline support at 153.50.
While the pair has lost upward momentum, it retains a constructive technical profile, with prices above key moving averages and still displaying higher highs and lower lows. However, to have confidence in the bullish outlook, the pair needs to overtake resistance, stretching from 156.20 to 156.70. If this scenario plays out, buyers may launch an attack on the 2023 highs near 158.00.
In contrast, if sellers manage to push EUR/JPY lower, initial support rests at the psychological 154.00 level, near an ascending trendline extended off the late March lows. A sustained break below this floor could reinforce bearish pressure, setting the stage for a slide toward 153.45, followed by 151.60.
EUR/JPY TECHNICAL CHART
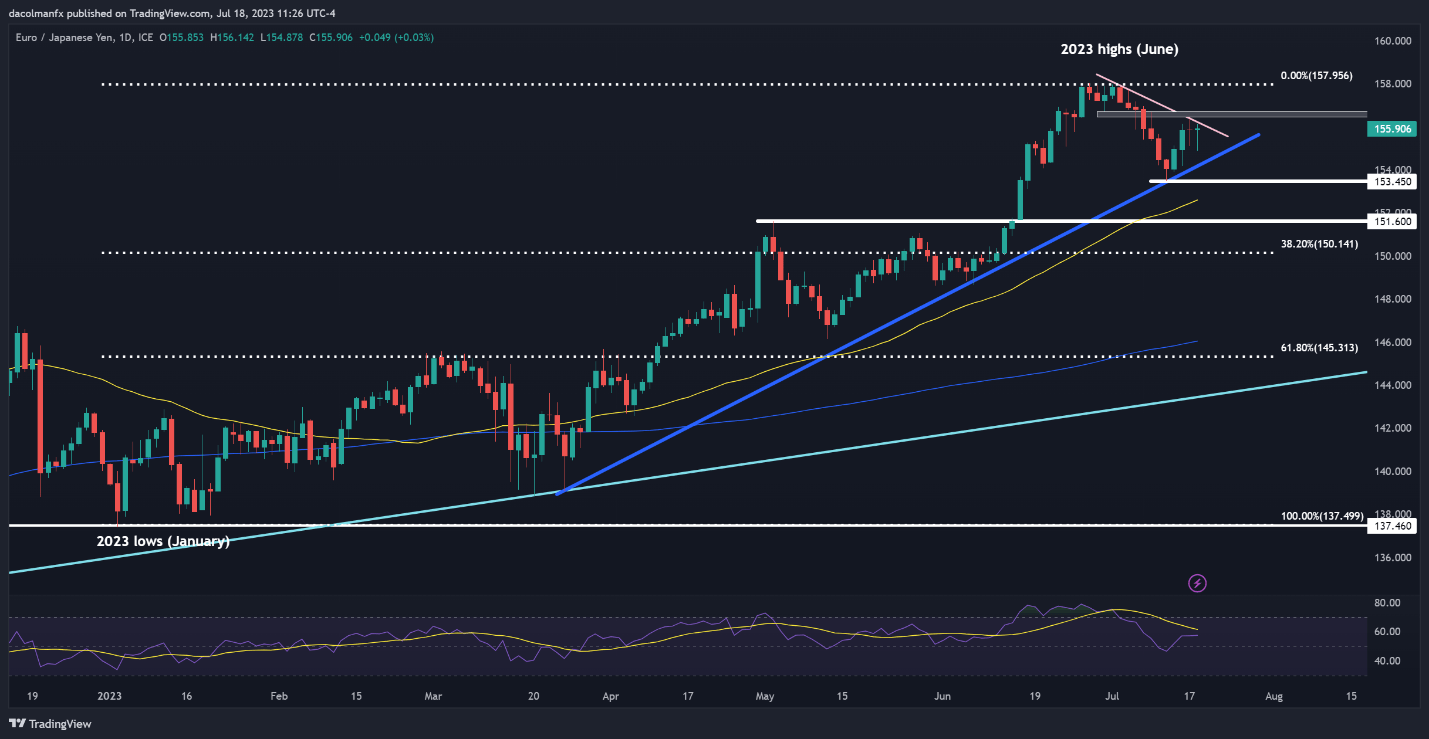
EUR/JPY Chart Prepared Using TradingView