


Japanese Yen, USD/JPY, US Dollar, JGB, Treasury Yields, Crude Oil, Powell - Talking Points
- USD/JPY eyes new highs with the US Dollar under scrutiny
- JGB yields have been outdone by Treasury yields ahead of Powell
- If the Israel – Hamas war expands, will USD/JPY resume rallying?

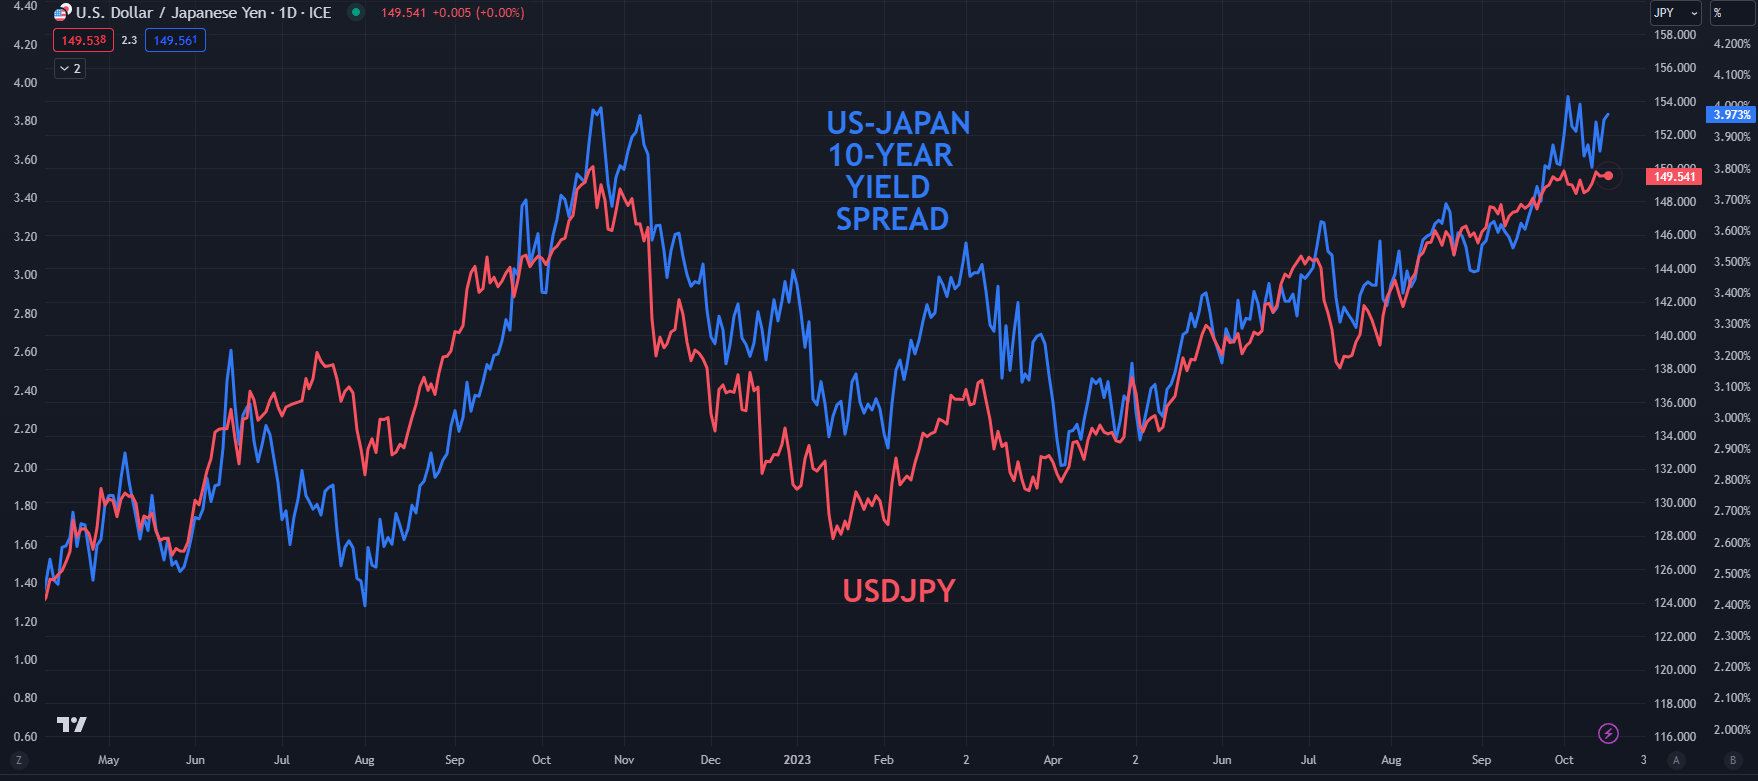
USD/JPY is homing in on the highs above 150 with elevated Japanese Government Bond (JGB) yields being outstripped by rising Treasury returns in a geopolitical environment that has seen haven assets underpinned to an extent.
10-year JGBs nudged 0.81% two weeks ago and continue to trade nearby at 0.76% going into Tuesday’s session. At the same time, the 10-year Treasury note is trading above 4.70% after eclipsing 4.88% earlier in the month.
The spread between the bonds favours the US Dollar and might add upside pressure to the exchange rate.
USD/JPY AND JP-US 10-YEAR BOND SPREAD
Elsewhere, USD lost ground going into the North American close but has steadied through the Asian session so far today.
The Australian Dollar has seen the largest gains over the last 24 hours, reclaiming 0.6350 and the Kiwi Dollar has recovered some of the losses seen in the aftermath of CPI printing at 5.6% year-on-year, below estimates of 5.9%.
Crude oil prices have slipped again today as the Israeli – Hamas war remains in focus. There is a growing view in the market that if the conflict is regionally contained then it may not impact global supply as much as originally thought.
The WTI futures contract is near US$ 86.30 bbl while the Brent contract is a touch below US$ 89.50 bbl at the time of going to print. Live prices can be seen to the right of this article.
APAC equities have mostly followed Wall Street’s lead to score a positive day. India’s indices are an exception, trading slightly in the red.
US President Joe Biden is anticipated to visit Israel later this week while Russian President Vladimir Putin arrived in Beijing today for the Belts and Roads conference.
In what could be the highlight for markets this week, Fed Chair Jerome Powell is anticipated to deliver an address on Thursday to the Economic Club of New York.
It would appear likely to be his last opportunity to make a public statement before the blackout period begins this Saturday ahead of the Federal Open Market Committee (FOMC) meeting running over October 31 and November 1st.
Interest rate markets are not pricing in any change in the Fed funds target rate at this meeting.
Spot gold has peeled lower again, trading below US$ 1,915 going into the European session.
After UK jobs data and the German ZEW survey, the US will see retail sales figures and Canada will get its latest CPI print.
The full economic calendar can be viewed here.

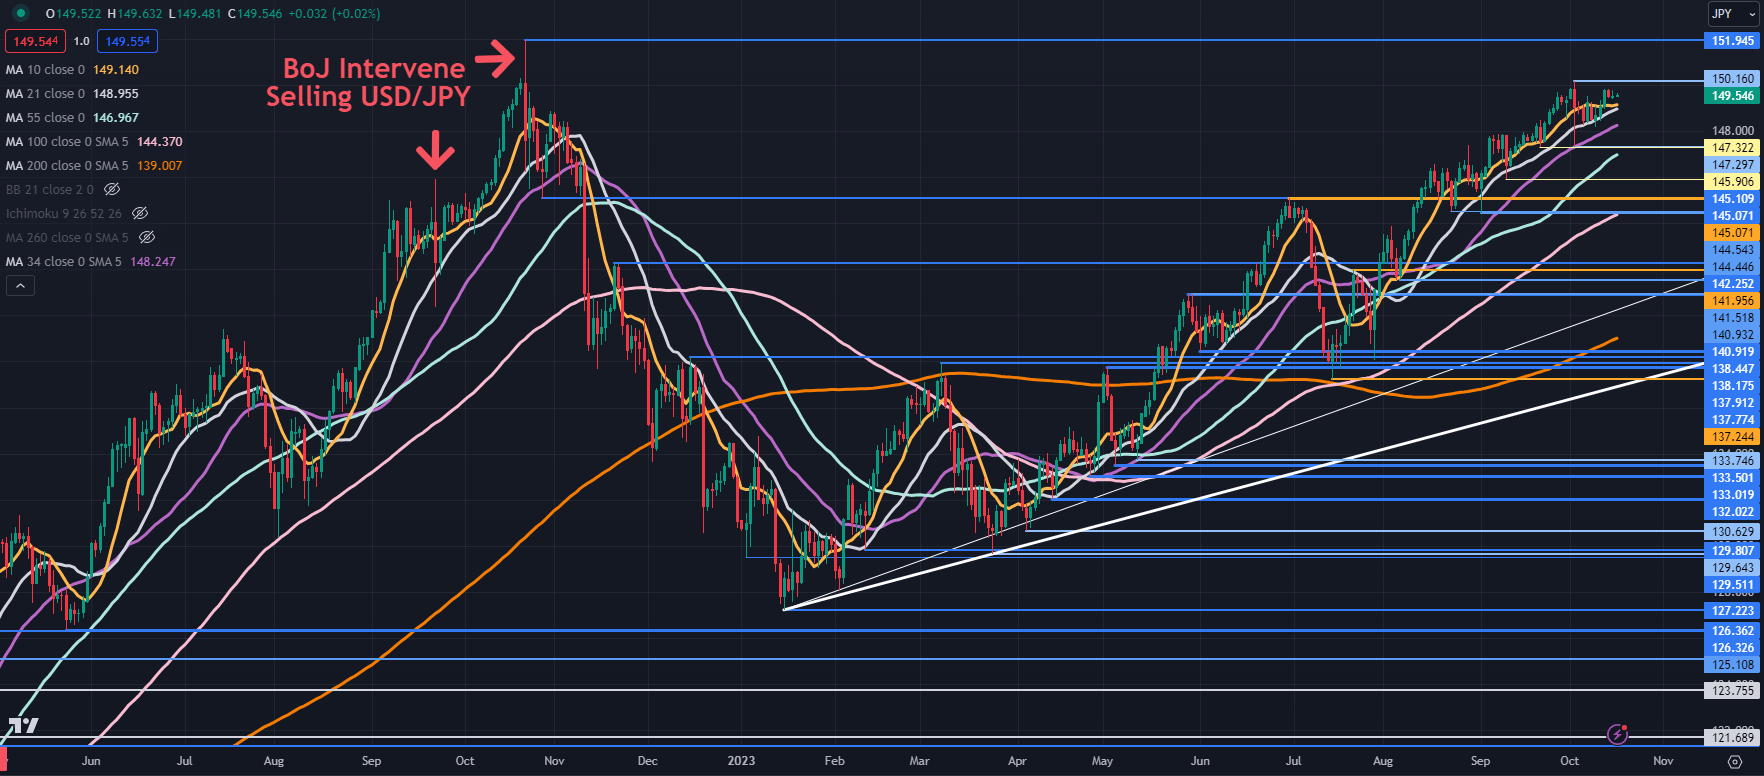
USD/JPY TECHNICAL ANALYSIS SNAPSHOT
USD/JPY is inching closer to the 12-month high seen at the start of October and a break above there could see a run toward the 33-year peak seen at this time last year at 151.95.
Such a move risks the possibility of the Bank of Japan (BoJ) physically intervening in the foreign exchange market.
A bullish triple moving average (TMA) formation requires the price to be above the short-term SMA, the latter to be above the medium-term SMA and the medium-term SMA to be above the long-term SMA. All SMAs also need to have a positive gradient.
When looking at any combination of the 10-, 21-, 34-, 55-, 100- and 200-day SMAs, the criteria for a TMA have been met and might suggest that bullish momentum is evolving. To learn more about trend trading, click on the banner below.
On the downside, support may lie at the recent lows near 147.30 and 145.90 or further down at the breakpoints in the 145.05 – 145.10 area ahead of the prior lows near 144.50 and 141.50.

--- Written by Daniel McCarthy, Strategist for DailyFX.com
Please contact Daniel via @DanMcCarthyFX on Twitter


