


US Dollar, Euro, Australian Dollar Vs Japanese Yen – Price Action:
- USD/JPY looks overbought, but there is no reversal of the uptrend.
- EUR/JPY holding gains following the recent bullish break
- AUD/JPY rally looks tired.

The Japanese yen found some bids after Japanese wages rose significantly more than expected, lowering the hurdle for the Bank of Japan to tweak its ultra-loose monetary policy.
Japanese workers’ wages rose 2.5% in May Vs 1.2% expected, and 1.0% in April, reflecting the major labour unions' wage negotiations this spring that resulted in the biggest increase in pay increase in decades. While many don’t expect the BOJ to adjust policy this year, a few analysts expect tweaks in the yield curve control (YCC) policy later this month.
The continued resilience of the global economy and the resulting upward pressure on bond yields could trigger an adjustment in the YCC policy. However, extreme tightening in financial conditions could cause strains in the financial system, leading to a credit crunch, forcing monetary policy to be eased instead. BOJ summary of opinions at the June policy meeting released recently quoted one board member saying the central bank should debate tweaking YCC to improve market function and mitigate its “high cost”.
USD/JPY 240-Minute Chart
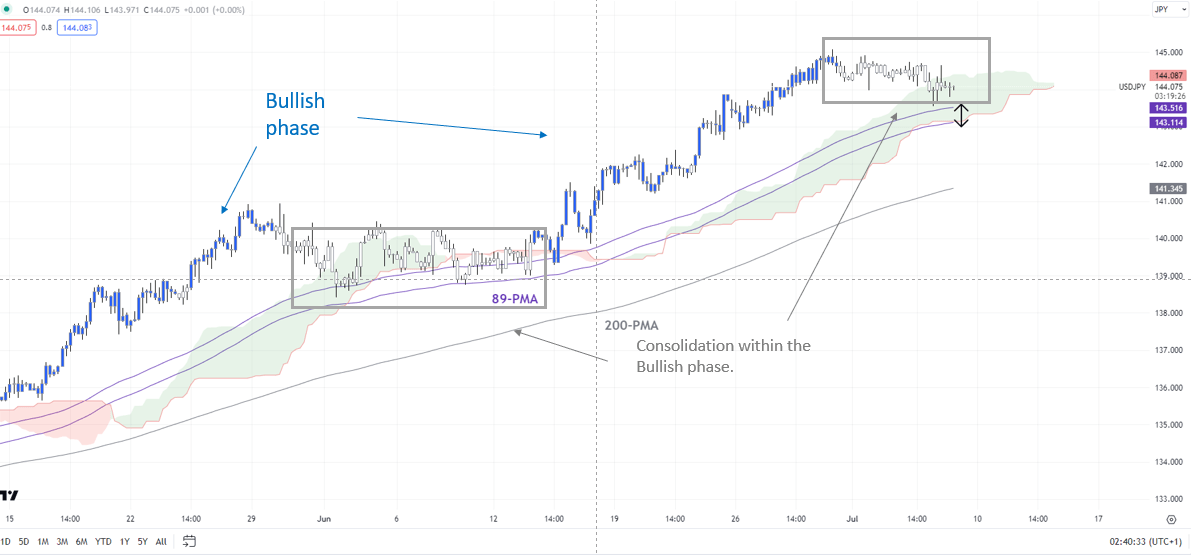
Chart Created by Manish Jaradi Using TradingView; Refer to notes at the bottom.
BOJ left its ultra-loose policy settings unchanged earlier this month, especially the closely watched YCC policy, in a bid to support the nascent economic recovery and sustainably achieve its inflation goal. BOJ Governor Kazuo Ueda has said the central bank would ‘patiently’ maintain the current policy as there is still some way to stably and sustainably achieve its 2% inflation target.
Meanwhile, the market remains wary of intervention by Japanese authorities as USD/JPY touched 145.00 recently, near the level that triggered an intervention last year for the first time in more than 20 years. Japan’s top officials have said they haven’t ruled out any options.
USD/JPY Daily Chart
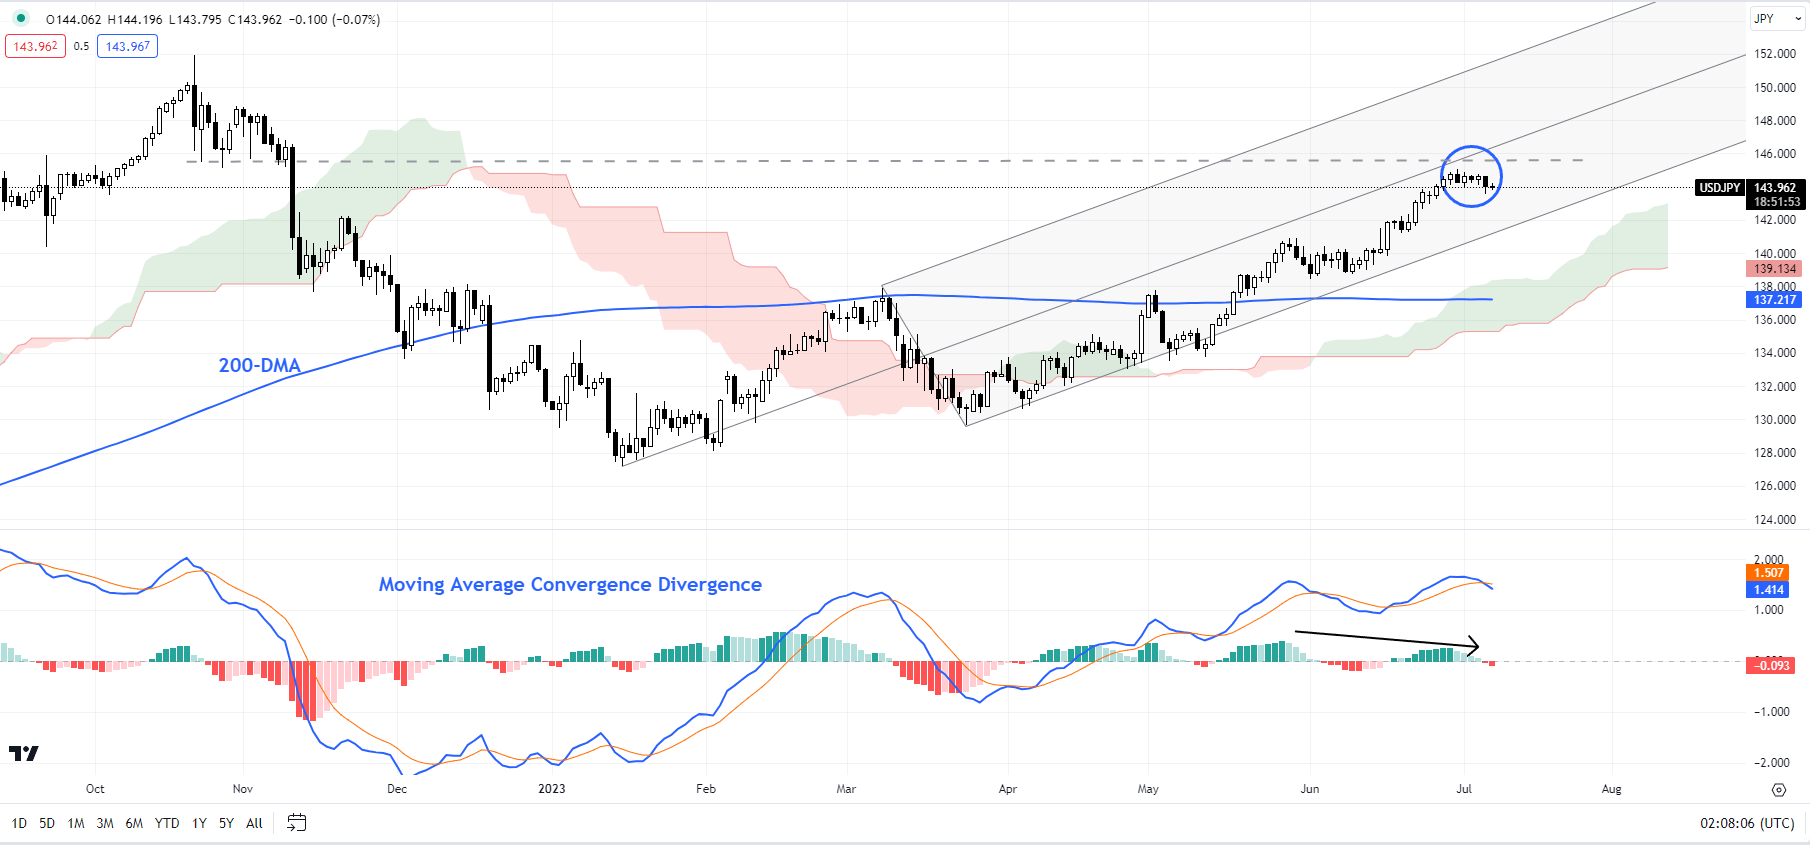
Chart Created by Manish Jaradi Using TradingView
USD/JPY: No sign of reversal yet
On technical charts, USD/JPY has moved to a consolidation phase within the broader bullish phase recently, as the colour-coded candlestick charts show. There is quite strong converged support on the 89-period moving average and the lower edge of the Ichimoku cloud on the 4-hourly charts. This cushion is strong as it triggered a rebound in USD/JPY last month. Hence a hold above the support can’t be ruled out. However, any break below the support could pave the way toward the 200-period moving average on the 4-hourly chart at about 141.00.
EUR/JPY Monthly Chart
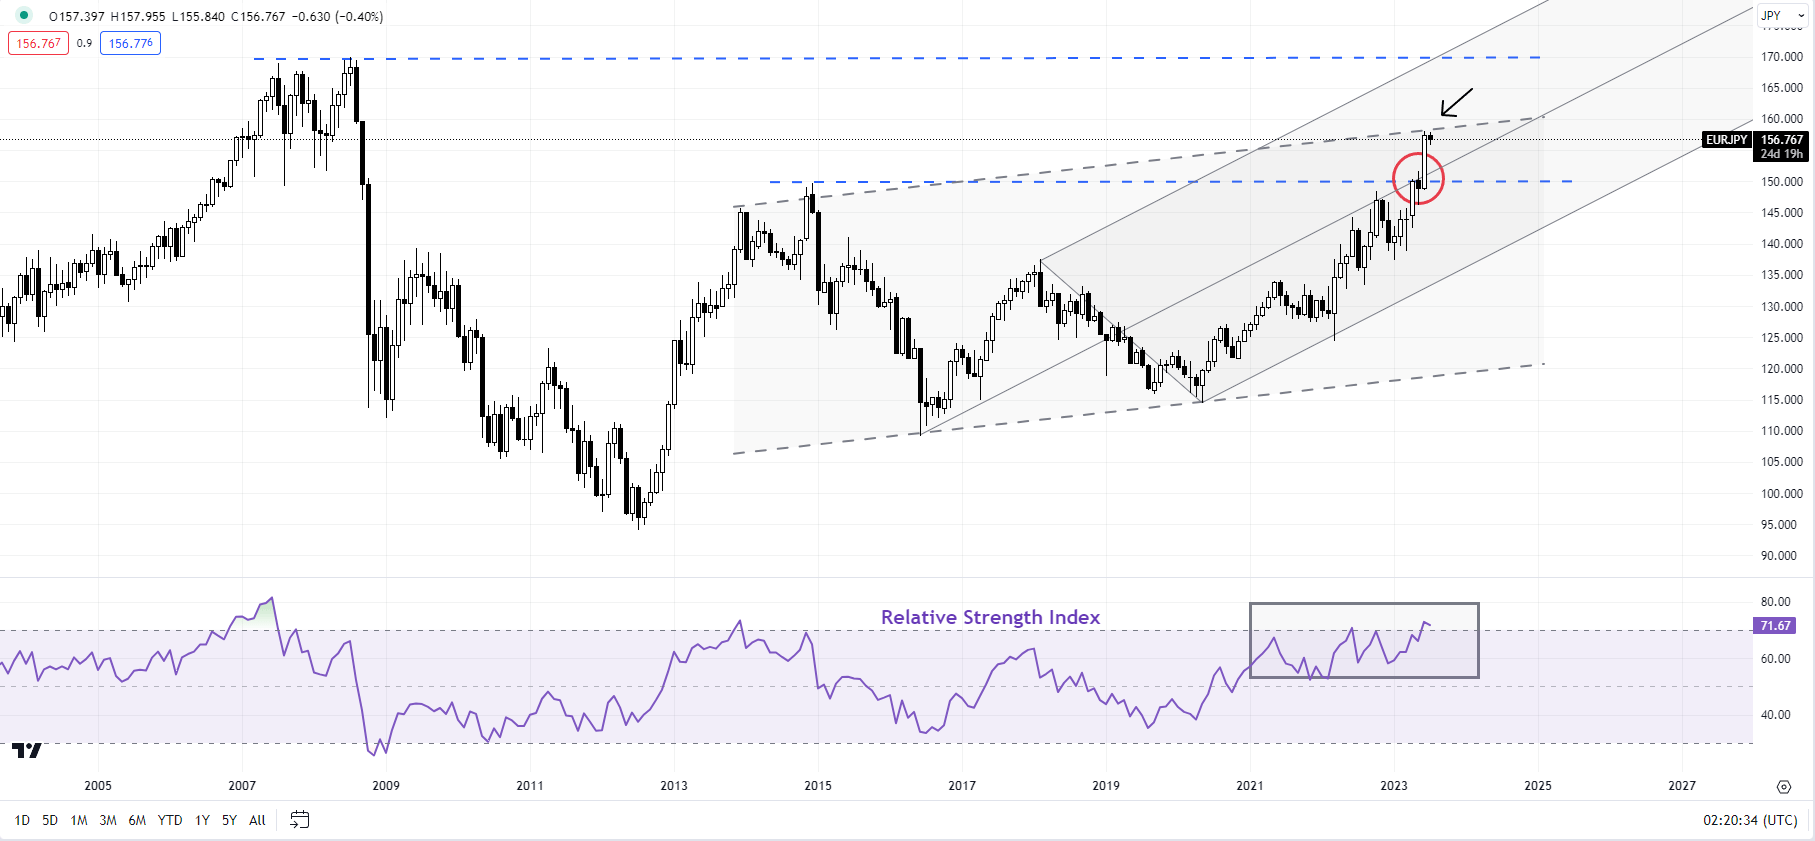
Chart Created by Manish Jaradi Using TradingView
EUR/JPY: Overbought, but uptrend remains intact
EUR/JPY is looking overbought as it tests resistance on the upper edge of a slightly upward-sloping channel from 2013. Some consolidation can’t be ruled out within the broader uptrend. This follows a rise above a vital converged barrier at the 2014 high of 149.75, coinciding with the median line of a pitchfork channel from 2016. A decisive break (two monthly closes) above could open the door toward the 2008 high of 170.00.
AUD/JPY Monthly Chart
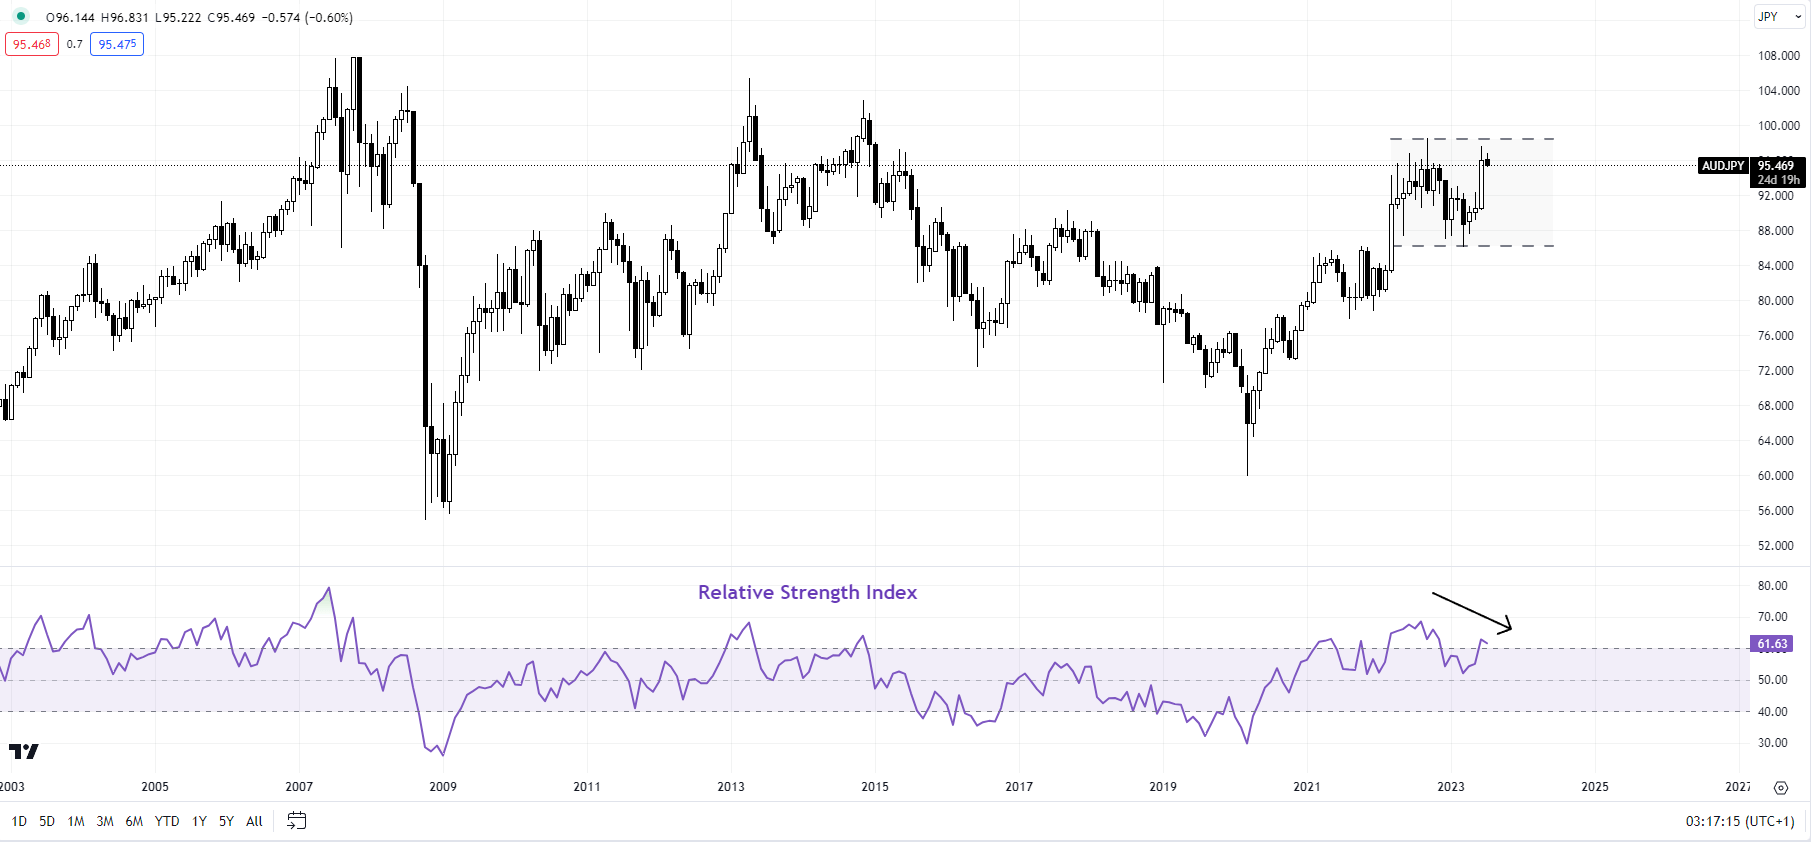
Chart Created by Manish Jaradi Using TradingView
AUD/JPY: Rally looks tired for now
A negative divergence (a flattening in price associated with declining momentum) on the monthly charts suggests AUD/JPY’s rally is losing steam in the near term. There is a chance that the cross could continue to move sideways in the recently established range of 86.00-98.50. Only a break below 86.00 would indicate that the broader upward pressure had faded.
Note: The above colour-coded chart(s) is(are) based on trending/momentum indicators to minimize subjective biases in trend identification. It is an attempt to segregate bullish Vs bearish phases, and consolidation within a trend Vs reversal of a trend. Blue candles represent a Bullish phase. Red candles represent a Bearish phase. Grey candles serve as Consolidation phases (within a Bullish or a Bearish phase), but sometimes they tend to form at the end of a trend. Candle colors are not predictive – they merely state what the current trend is. Indeed, the candle color can change in the next bar. False patterns can occur around the 200-period moving average, or around a support/resistance and/or in sideways/choppy market. The author does not guarantee the accuracy of the information. Past performance is not indicative of future performance. Users of the information do so at their own risk.

--- Written by Manish Jaradi, Strategist for DailyFX.com
--- Contact and follow Jaradi on Twitter: @JaradiManish


