


Gold (XAU/USD) Analysis, Prices, and Charts
- US Treasury yields stem recent sell-off.
- US NFPs are the next potential driver of price action.

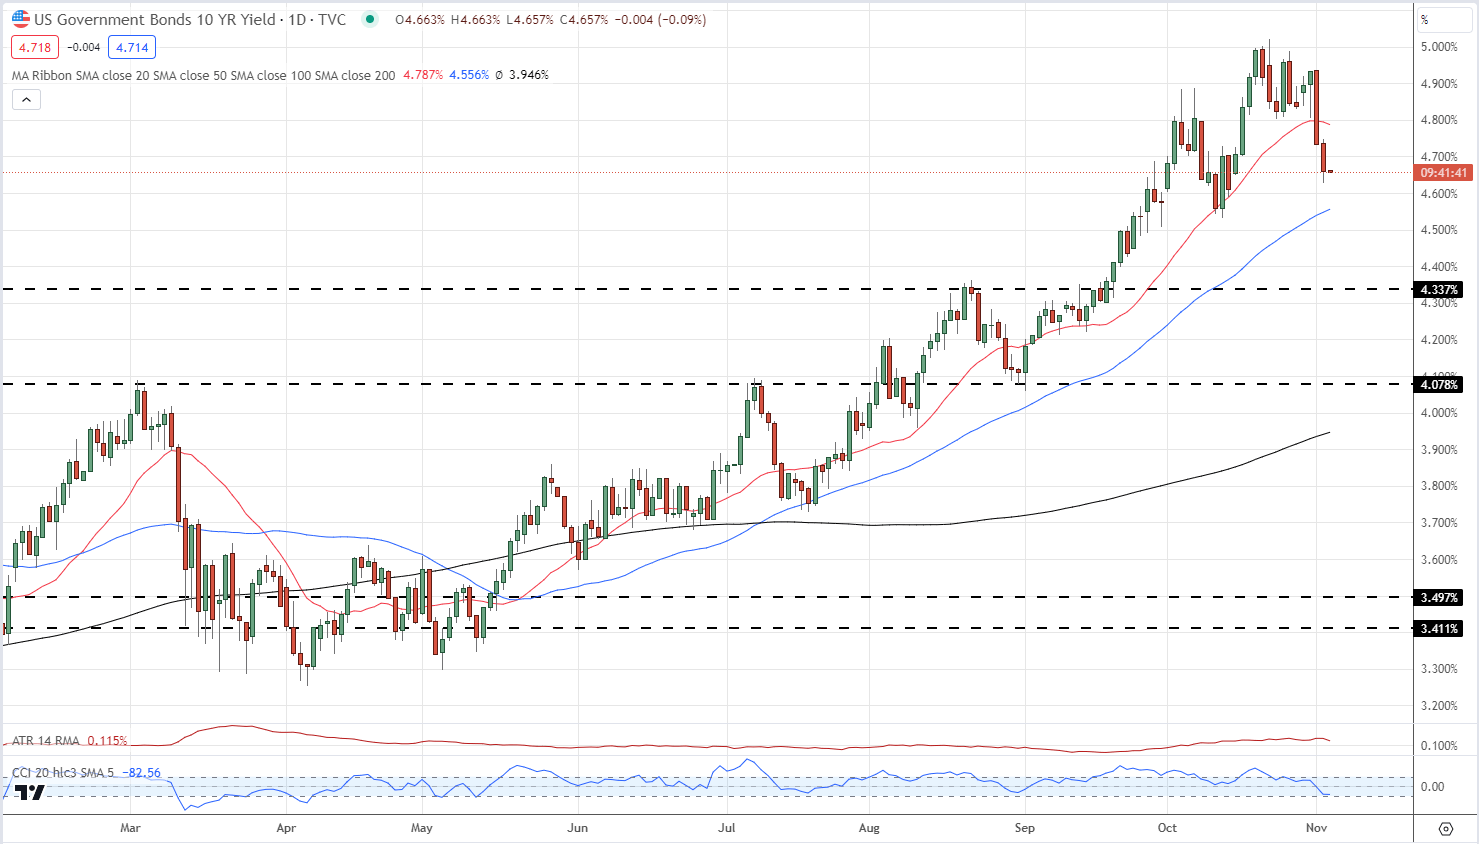
Gold is struggling to regain its recent highs despite US Treasury yields turning sharply lower this week. There is a growing market sentiment that global bond yields have peaked, especially in the longer-end, and with recession fears growing, the market is continuing to price in peak rates. After trading above 5% less than two weeks ago, the yield on the US 10-year benchmark is currently at 4.66%, while the 30-year long bond is now offered at 4.82% compared to a peak of 5.18% on October 23rd. The 5.02% print on the US 10-year was a new 16-year high.
US Treasury 10-Year Yield
Coming up shortly is the closely watched US Jobs Report (NFP), a known market mover. The US jobs market remains robust and the Fed would like to see the labor market weaken as the US central bank continues to battle with above-target inflation. Around 180k new jobs are expected to have been created in October and any miss of this forecast or a meaningful revision lower of last month’s blockbuster 336k could see bond yields, and the US dollar, move lower.
Gold is in a holding pattern ahead of today’s jobs data and is unlikely to move ahead of the release. The precious metal tries to break resistance at $2,009/oz. on three occasions but has been unsuccessful so far. Support is seen at $1,973/oz. ahead of $1,960/oz.

Gold Daily Price Chart – November 3, 2023
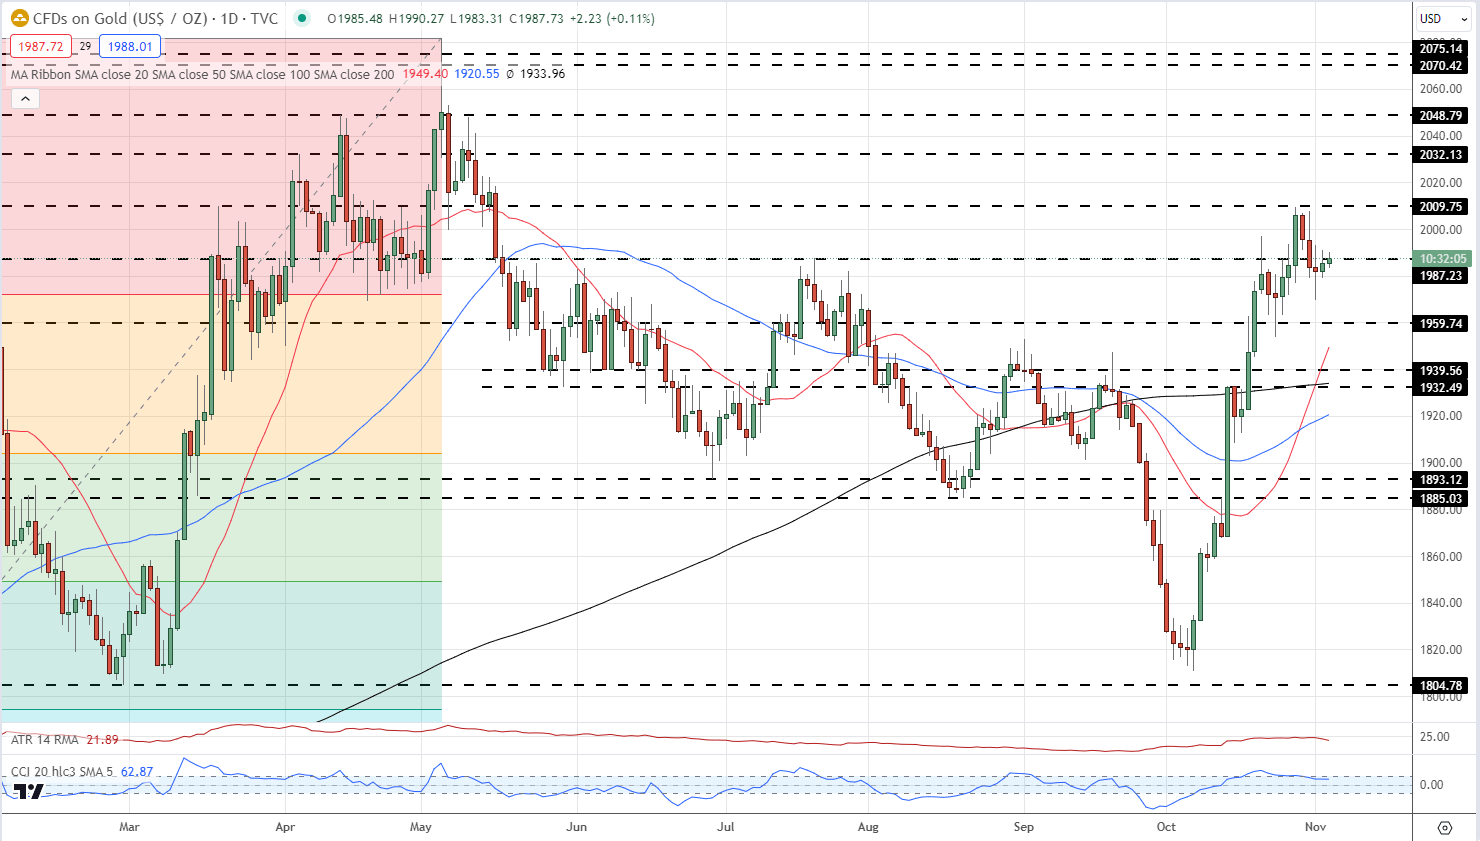
Chart via TradingView
IG Retail Trader data shows 59.72% of traders are net-long with the ratio of traders long to short at 1.48 to 1.Download the full Gold Sentiment Report to see how daily and weekly changes affect price sentiment
| Change in | Longs | Shorts | OI |
| Daily | -14% | 12% | -2% |
| Weekly | -8% | 13% | 2% |
What is your view on Gold – bullish or bearish?? You can let us know via the form at the end of this piece or you can contact the author via Twitter @nickcawley1.


