


Gold Price (XAU/USD) Analysis, Price, and Chart
- Strong US economic data send gold spinning lower.
- Friday’s Core PCE data will be key for gold going into the weekend.

Gold has given back $25+ today after the latest batch of US data showed the American economy in rude health. Durable goods m/m beat expectations by a wide margin, the first look at Q2 GDP also beat by a margin, while jobless claims fell and core PCE prices also came in below market forecasts. If tomorrow’s Core PCE Price Index and Michigan Consumer Sentiment carry on in the same vein, thoughts of a soft landing in the US will grow further.
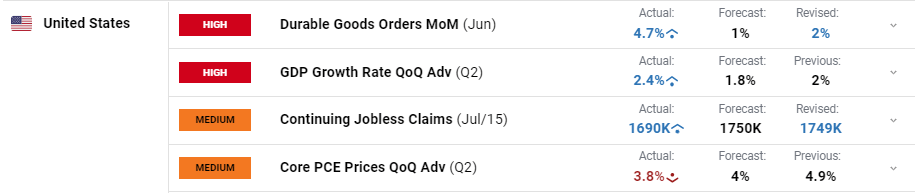

US Second-Quarter GDP Growth Shatters Expectations, Boosting Yields and the Dollar
Today’s uptick in US Treasury yields are hitting the precious metal hard, sending it through a recent level of short-term support at $1,960/oz. The technical outlook is starting to turn negative with the current price action also looking to drop below both the 20- and 50-day simple moving averages and towards a prior support zone between $1,940/oz. and $1,932.6/oz. A confirmed break below here would leave $1,900/oz. the next level of support.
Gold Daily Price Chart – July 27, 2023
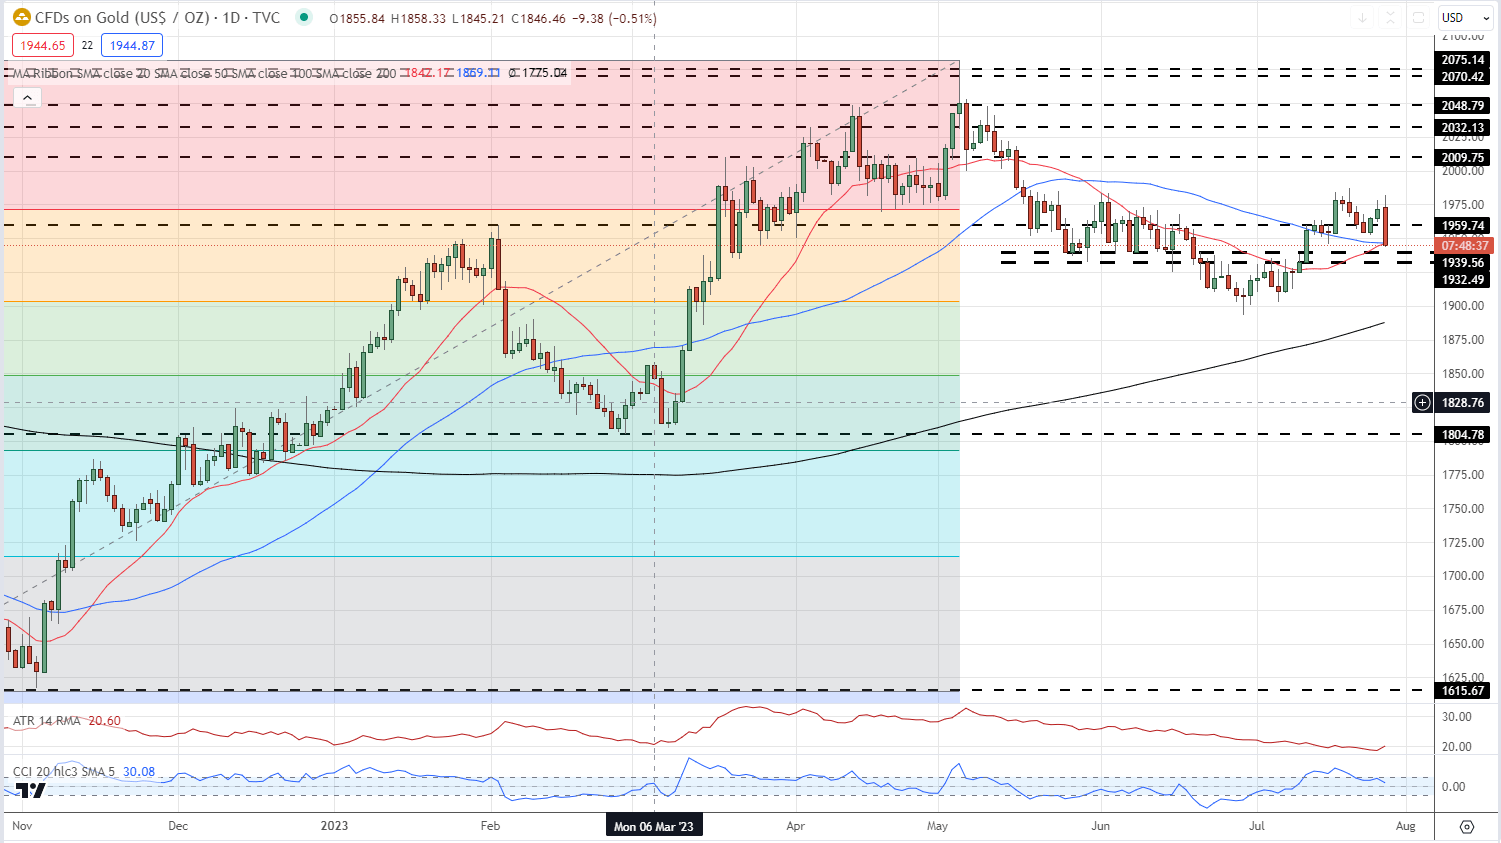
Chart via TradingView
| Change in | Longs | Shorts | OI |
| Daily | -6% | 6% | 0% |
| Weekly | -13% | 20% | 1% |
Retail Remain Long of Gold Despite Trimming Short Positions
Retail trader data shows 65.60% of traders are net-long with the ratio of traders long to short at 1.91 to 1.The number of traders net-long is 1.72% higher than yesterday and 1.84% higher than last week, while the number of traders net-short is 10.69% lower than yesterday and 8.55% lower than last week.
We typically take a contrarian view to crowd sentiment, and the fact traders are net-long suggests Gold prices may continue to fall. Traders are further net-long than yesterday and last week, and the combination of current sentiment and recent changes gives us a stronger Gold-bearish contrarian trading bias.
What is your view on Gold – bullish or bearish?? You can let us know via the form at the end of this piece or you can contact the author via Twitter @nickcawley1.


