


Gold (XAU/USD) Analysis, Prices, and Charts
- Macro backdrop remains supportive for gold.
- The 200-day simple moving average is now in play.

According to a range of media reports, US President Joe Biden and Israel’s government have agreed to a relief plan that ‘minimizes civilian casualties and enables humanitarian assistance to flow to civilians in Gaza in a way that does not benefit Hamas’, according to US Secretary of State, Antony Blinken. President Biden will visit Israel on Wednesday and will also go on to meet King Abdullah II of Jordan, Egyptian President Abdel Fatah al-Sisi, and Palestinian President Mahmoud Abbas in an effort to control any spread of violence in the region. Iran has warned of ‘pre-emptive’ action against Israel if the current situation worsens.
The recent violence in the Middle East has seen gold grab a strong haven bid, pushing the precious metal sharply higher. This comes despite US Treasury yields pushing higher and nearing their multi-year highs. US 2s are offered with a yield of 5.11%, while the benchmark US 10-year is trading with a yield to maturity of 4.75%. The market it seems is currently pricing in political risk above interest rate expectations.
The daily gold chart is looking interesting with the longer-dated simple moving average now in play. The 200-day sma is currently capping any move higher and a confirmed break higher – close and open – is needed to bring resistance at $1.939/oz. and $1,959/oz. into play. Gold is showing a bullish series of seven higher lows and this should underpin the price and keep the bullish move in place. Support starts around $1,904/oz. (38.2% Fibonacci retracement) ahead of $1,900/oz. and $1,893/oz.
Gold Daily Price Chart – October 17, 2023
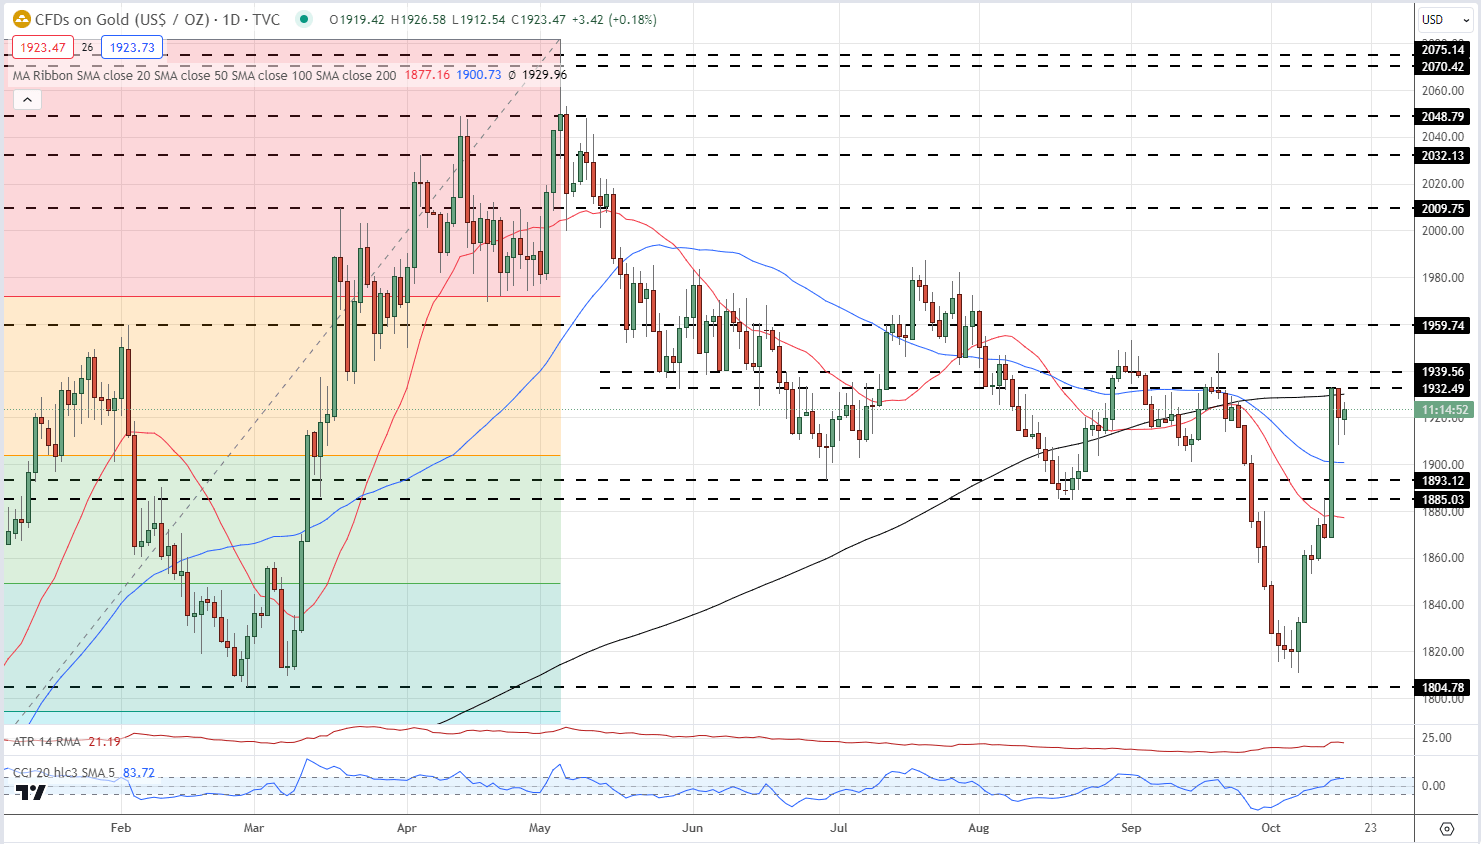
Chart via TradingView
Retail trader data shows 72.41% of traders are net-long with the ratio of traders long to short at 2.62 to 1.The number of traders net-long is 7.95% higher than yesterday and 25.26% lower than last week, while the number of traders net-short is 4.97% lower than yesterday and 71.44% higher than last week.
We typically take a contrarian view to crowd sentiment, and the fact traders are net-long suggests Gold prices may continue to fall.
| Change in | Longs | Shorts | OI |
| Daily | -14% | 12% | -2% |
| Weekly | -8% | 13% | 2% |
What is your view on Gold – bullish or bearish?? You can let us know via the form at the end of this piece or you can contact the author via Twitter @nickcawley1.


