


Gold Price (XAU/USD) Analysis, Price, and Chart
- A week packed full of US labor market data mat steer the Fed.
- Gold pushing into a prior zone of support.
This week’s US job openings data (JOLTs) sent US Treasury yields tumbling lower, giving both gold and silver a boost. The July data showed a sharp contraction in job openings while the prior month’s figure was also revised sharply lower. The number of openings fell for a third consecutive month and touched lows last seen in March 2021.
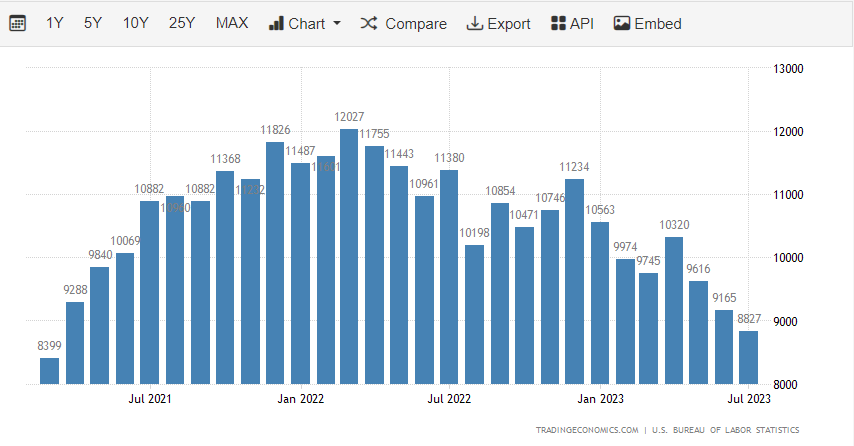
Fed chair Jerome Powell will have noted yesterday’s data and will also be closely following further labor data this week. Today see the release of the August ADP employment change – expected 195k vs. 324k in July – while tomorrow sees the weekly initial jobless claims – 235k forecast vs. a prior week’s 230k. And on Friday the monthly US Jobs Report (NFP) will be released at 13:30 UK with the market looking for +170k new nonfarm jobs compared to last month’s 187k. The Federal Reserve is looking closely at the jobs market and any further signs of weakness will allow the US central bank more time to leave interest rates unchanged, and potentially bring forward the first rate cut.

Gold is now back in a prior zone of support and is looking to break higher. The last week’s price action has seen the precious metal break back above all three simple moving averages, although all three remain vulnerable to a pullback. If gold can close and open above the $1,940/oz. level, then the 23.6% Fibonacci retracement level at $1,972/oz. becomes the next target.
Gold Daily Price Chart – August 30, 2023
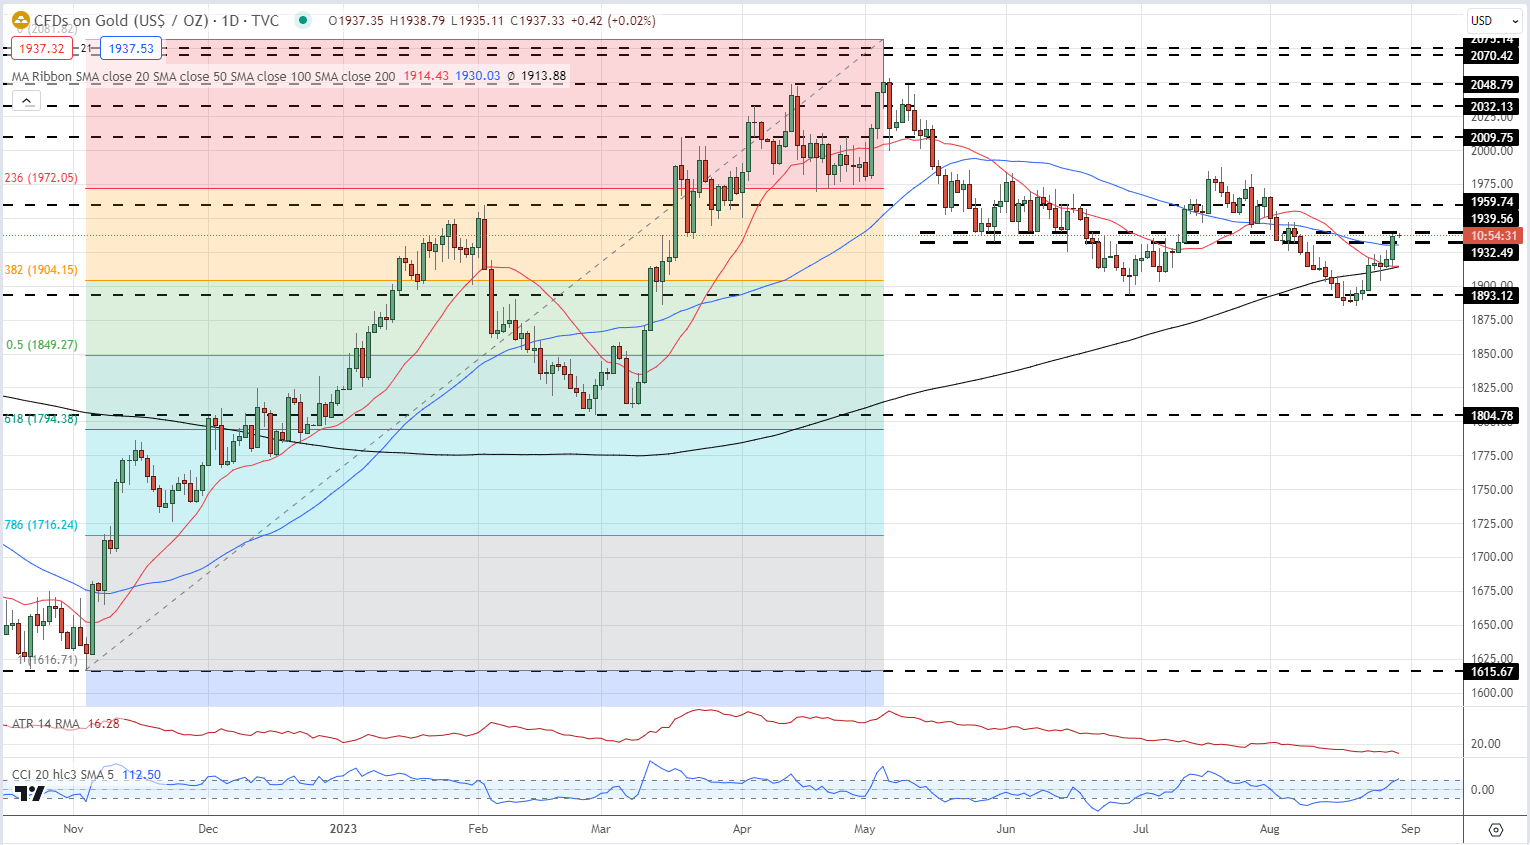
Chart via TradingView
Download the Latest Gold Sentiment
| Change in | Longs | Shorts | OI |
| Daily | 8% | -4% | 2% |
| Weekly | 2% | 2% | 2% |
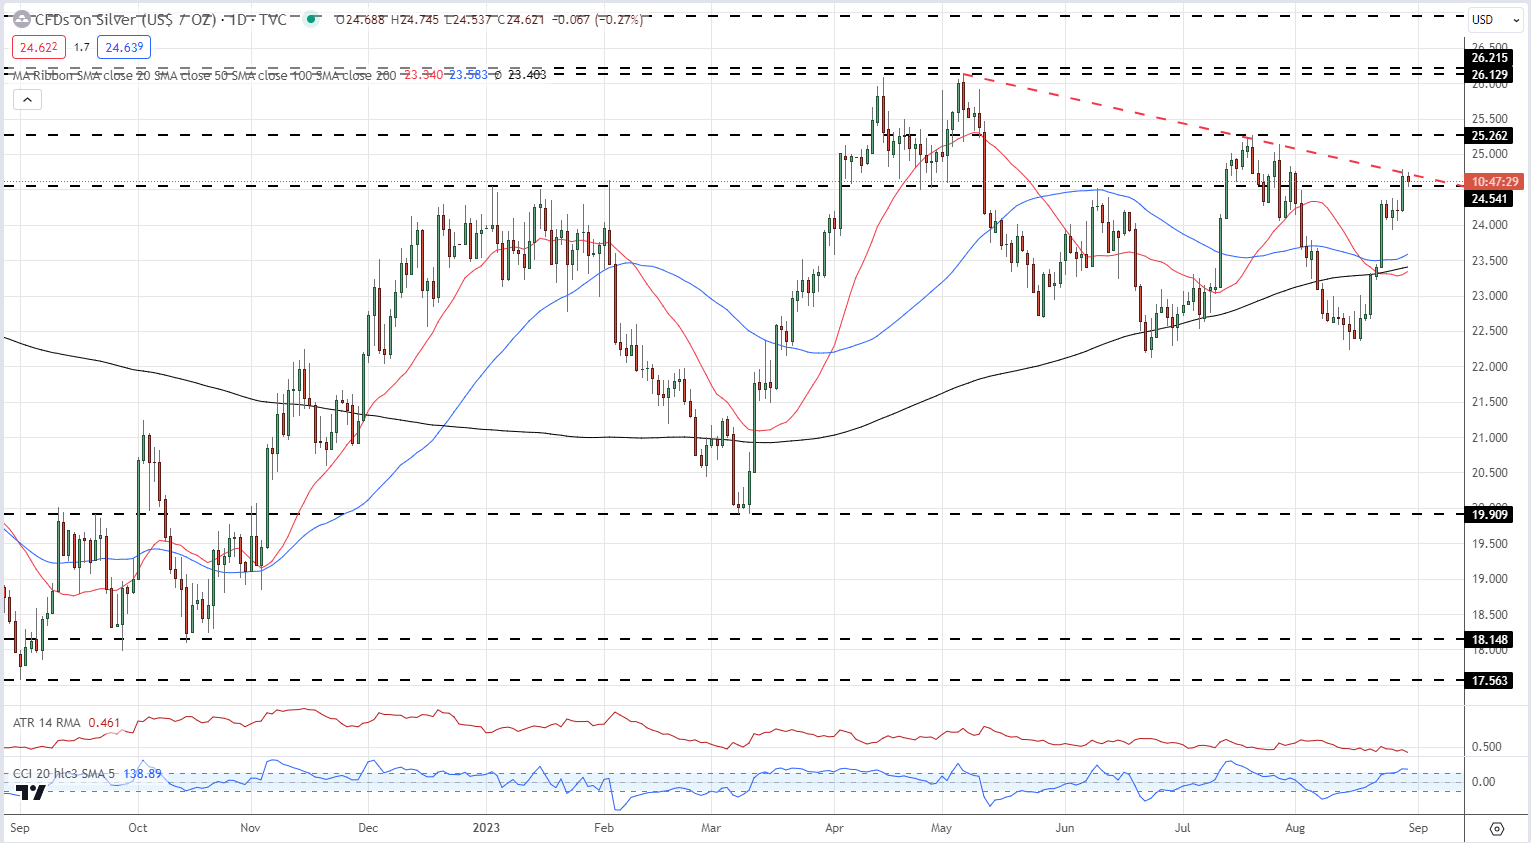
Silver posted a fresh one-month high yesterday and is around 10% higher over the last two weeks. There is overhead resistance at $25.26 before $26.13 comes into play. All three simple moving averages are supportive. A downtrend line from the May 5th high is now in play and needs to be convincingly broken to allow silver to move higher.
Silver Daily Price Chart – August 30, 2023

What is your view on Gold and Silver – bullish or bearish?? You can let us know via the form at the end of this piece or you can contact the author via Twitter @nickcawley1.


