


Gold Price Analysis and Charts
- Gold eyes a new multi-week low.
- Geopolitical tensions fail to support the precious metal.
Download our latest Q1 Gold Forecast below

Gold is trading close to last Friday’s low despite ongoing tensions in the Red Sea. According to a CNBC report, Chinese state-owned shipping company Cosco suspended shipping via the Red Sea over the weekend citing operational fears. Danish container shipping giant Maersk announced late last week that it would not be using Red Sea shipping routes for the foreseeable future, due to ongoing Houthi attacks.
Last Friday’s US jobs data sparked a bout of volatility. The US NFP report came in higher than expected, pushing the US dollar higher as rate expectations were pared back, before the latest US ISM Services report disappointed. The Services PMI fell from 52.7 to 50.6, while the Employment reading fell sharply from 50.7 to 43.3, deep in contraction territory.
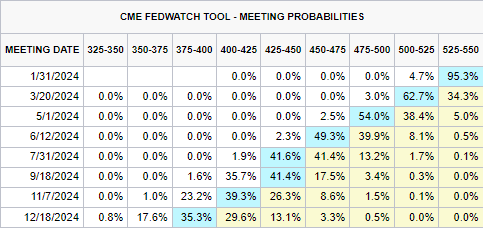
On Thursday this week, we have the latest US inflation reading. Core inflation y/y is seen dropping to 3.8% from 4.0%, while headline inflation is seen nudging up by 0.1% to 3.2%.
For all economic data releases and events see the DailyFX Economic Calendar
Gold has been moving lower this year and continues to print lower highs and lower lows. The precious metal is also trading below the 20-day simple moving average and a prior horizontal support at $2,032/oz. The next level of support is seen at $2,014/oz. (50-dsma) before a prior swing high at $2,009/oz. A break higher sees $2,043/oz. (20-dsma and prior horizontal resistance) come into focus.

Gold Daily Price Chart
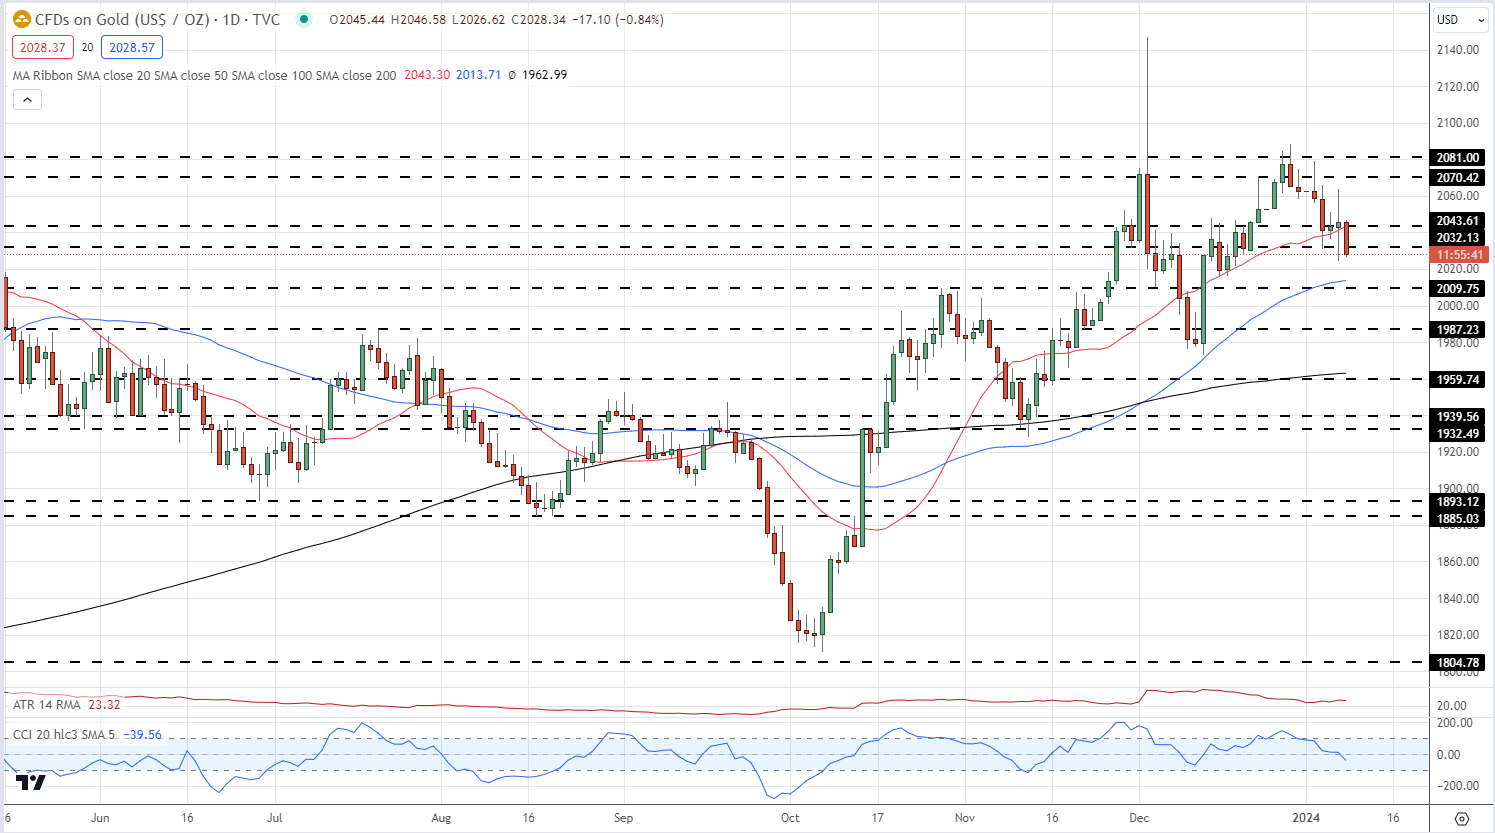
Chart via TradingView
Retail trader data shows 59.29% of traders are net-long with the ratio of traders long to short at 1.46 to 1.The number of traders net-long is 6.29% higher than yesterday and 0.75% higher than last week, while the number of traders net-short is 0.97% lower than yesterday and 13.42% lower than last week.
We typically take a contrarian view to crowd sentiment, and the fact traders are net-long suggests Gold prices may continue to fall.
See how changes in IG Retail Trader data can affect sentiment and price action.
| Change in | Longs | Shorts | OI |
| Daily | -6% | -5% | -6% |
| Weekly | -2% | -9% | -5% |
What is your view on Gold – bullish or bearish?? You can let us know via the form at the end of this piece or you can contact the author via Twitter @nickcawley1.


