


Gold, XAU/USD, US Dollar, Treasury Yields, Israel, Federal Reserve, GVZ Index - Talking Points
- The gold price has held the high ground going into Tuesday’s trading session
- Treasury yields appear to have rolled over after making new highs last week
- The US Dollar is under pressure despite global uncertainty. Will XAU/USD keep rallying?

The gold price bounced hard off a seven-month low to start this week in the aftermath of the outbreak of war in the Middle East, trading back above US$ 1,860 a troy ounce.
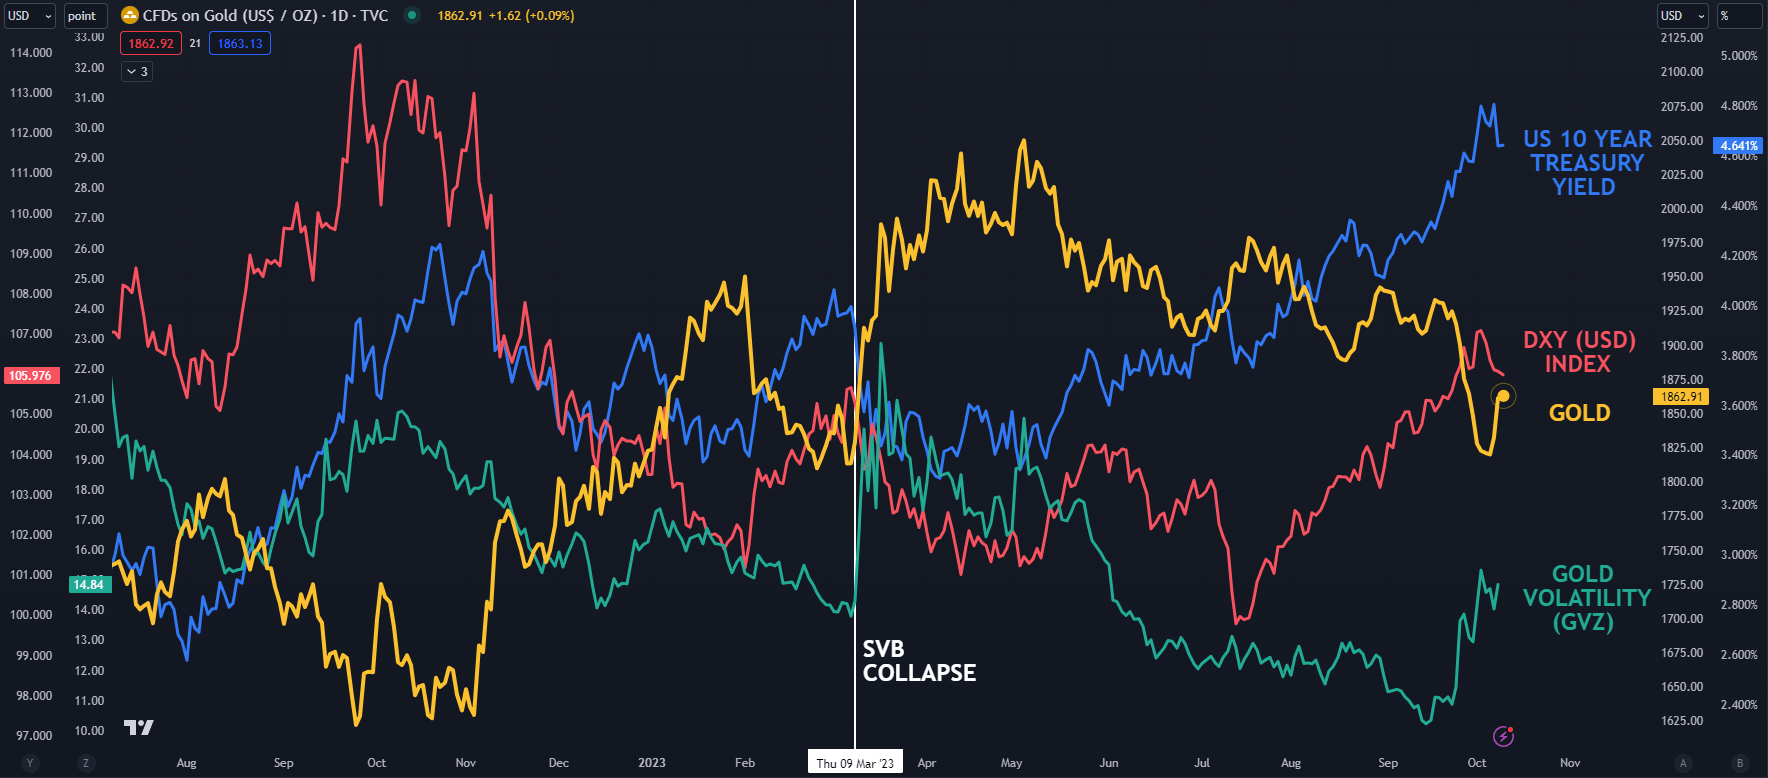
The perceived haven status of the precious metal helped to underpin but it has also seen the tailwinds of a weaker US Dollar with Treasury yields reversing the gains seen last week.
The benchmark 10-year bond eclipsed 4.88% on Friday, the highest return for the low-risk asset since 2007.
It has since collapsed below 4.65% this week after dovish comments from Federal Reserve Vice Chair Philip Jefferson and the Dallas Fed President Lorie Logan.
Somewhat ironically, both central bankers cited higher long-end Treasury yields as a reason to be less hawkish going forward. The interest rate market has now pretty much ruled out another hike by the Fed and sees a cut by the middle of next year.
Recent moves have seen volatility pick up for gold as measured by the GVZ index. This may suggest that further notable moves in the gold price might evolve.
The GVZ index measures volatility in the gold price in a similar way that the VIX index gauges volatility in the S&P 500.
SPOT GOLD, DXY (USD) INDEX, US 10-YEAR TREASURY AND GVZ INDEX
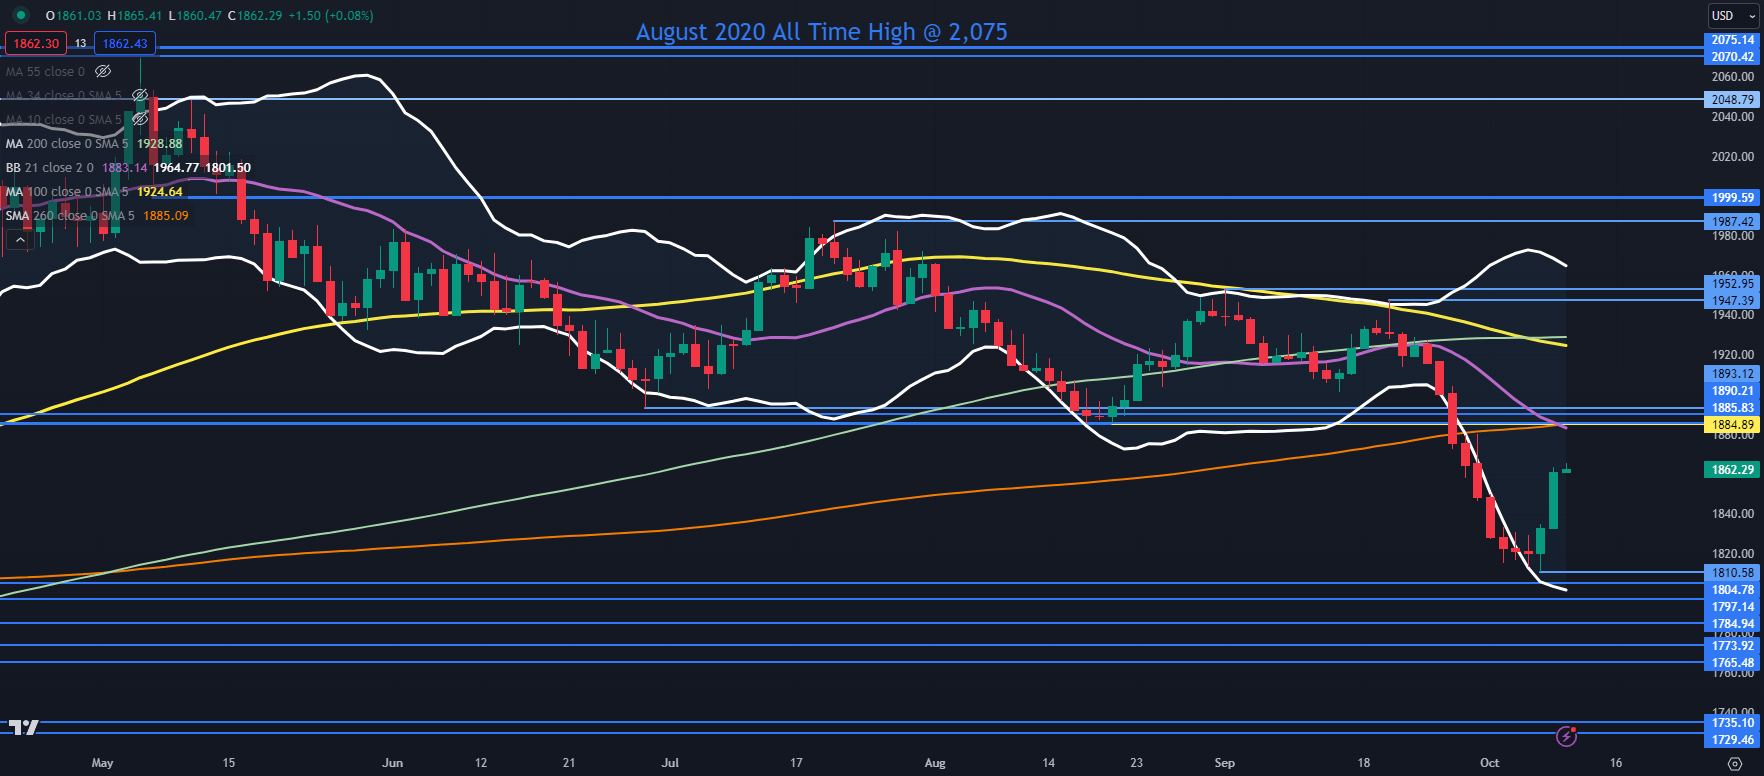
GOLD TECHNICAL ANALYSIS SNAPSHOT
The recent sell-off broke below the lower band of the 21-day simple moving average (SMA) based Bollinger Band.
Last Thursday it closed back inside the band to signal a pause in the bearish run and the consequent reversal. Click on the banner below to learn more bout Bollinger Bands.
Resistance could be in the 1885 – 1895 area where there are a series of breakpoints with the 21- and 260-day SMAs just below that zone, which may add to resistance.
Further up, the 100- and 200-day SMA lie ahead of 1930 and could offer resistance.
On the downside, support might be at the previous lows of 1810, 1805, 1797, 1785, 1774, 1766 and 1735.

SPOT GOLD CHART
Trade Smarter - Sign up for the DailyFX Newsletter
Receive timely and compelling market commentary from the DailyFX team
--- Written by Daniel McCarthy, Strategist for DailyFX.com
Please contact Daniel via @DanMcCathyFX on Twitter


