


XAU/USD PRICE FORECAST:
- Gold (XAU/USD) Bounces as the DXY Faces a Key Resistance Hurdle.
- The Higher Rates for Longer Narrative is Likely to Weigh on the Precious Metal Moving Forward as Fed Projections Price in Only 50bps of Cuts in 2024, Down from 100bps in June.
- IG Client Sentiment Shows that Retail Traders are Overwhelmingly Long on Gold with 74% Holding Long Positions.
- To Learn More About Price Action, Chart Patterns and Moving Averages, Check out the DailyFX Education Section.
MOST READ: The South African Reserve Bank: A Trader's Guide
Gold extended its losses in the European session before a rebound as the US session gathers steam. The Dollar Index and US treasury yields had kept Gold prices under pressure following the hawkish message from Fed Chair Jerome Powell yesterday.
Get the Latest Tips and Tricks to Trading Gold with Your Free Guide Below.

FED PROJECTIONS AND DOLLAR INDEX
The US Federal Reserve certainly didn’t disappoint on the idea of a ‘hawkish’ pause with the adjustments to the dot plot in particular raising eyebrows. The Fed adjusted the 2024 projections which in June indicated 100bps of cuts through 2024, this now shows just 50bps of cuts for next year. The Fed Chair was quick to point out however that the projections are not a plan and may be adjusted as needed.
The DXY for its part rallied sharply higher closing the day with a hammer candlestick on the daily chart while US Treasury Yields rose once more further weighing on Gold prices. US data released early in the US session came in largely positive and yet we are seeing a retreat from the Dollar index from a key area of resistance.
Dollar Index (DXY) Daily Chart
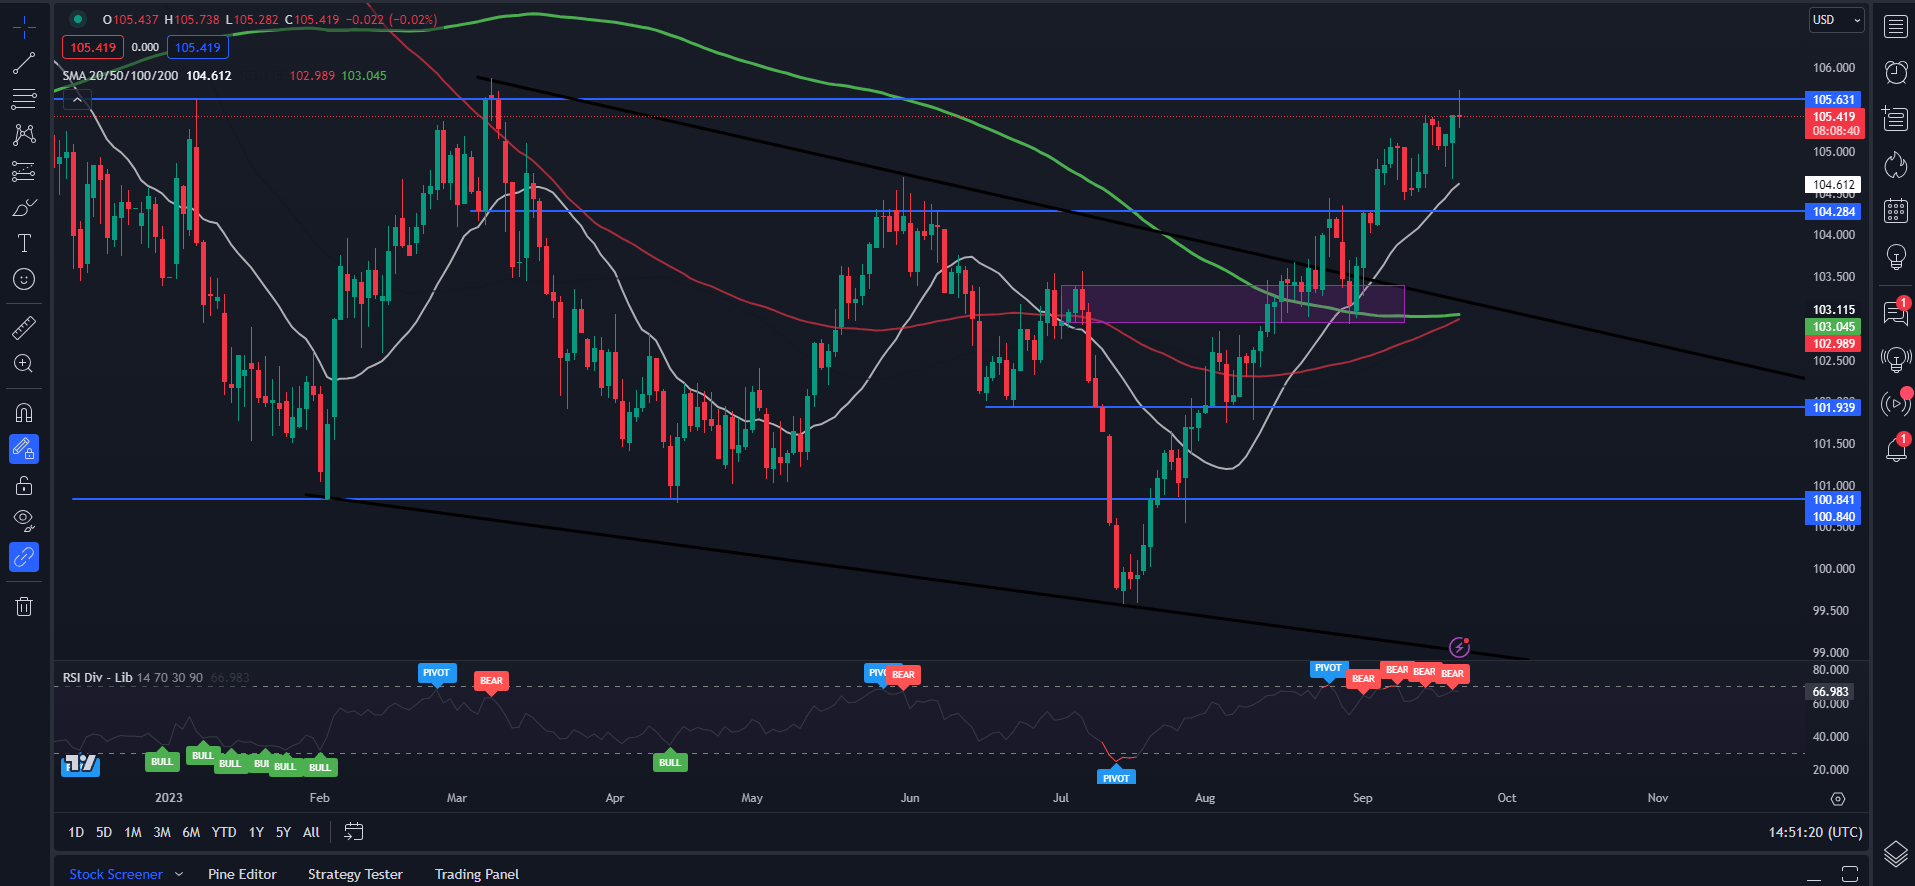
Source: TradingView, Created by Zain Vawda
Looking at the daily chart above and we can see the spike above the key resistance area around 105.63 before pulling back to trade at 105.30 at the time of writing. The daily candle at this stage is on course for a shooting star candle close which could hint at further downside. As mentioned previously however, the theme of 2023 has been a lack of conviction and the technical of the DXY are indicative of that.
The MAs are about to cross on the daily timeframe (100 and 200-day MAs) which would be a golden cross pattern which usually indicates bullish momentum and possible continuation. Now this could still occur but is in direct contradiction to the price action picture discussed above hinting at a deeper retracement. What does this mean? In my mind for now it appears we still lack a bit of clarity regarding longer-term moves and a shorter-term outlook maybe more attractive in the current climate.

RISK EVENTS AHEAD
The majority of the major risk events for the week are now out of the way, at least where the US Dollar is concerned. We do have the S&P Global PMI data due tomorrow and some Fedspeak which will be followed up by some US data next week. None however expected to be major market moving releases and could just provide some short-term spikes depending on the nature of the release.
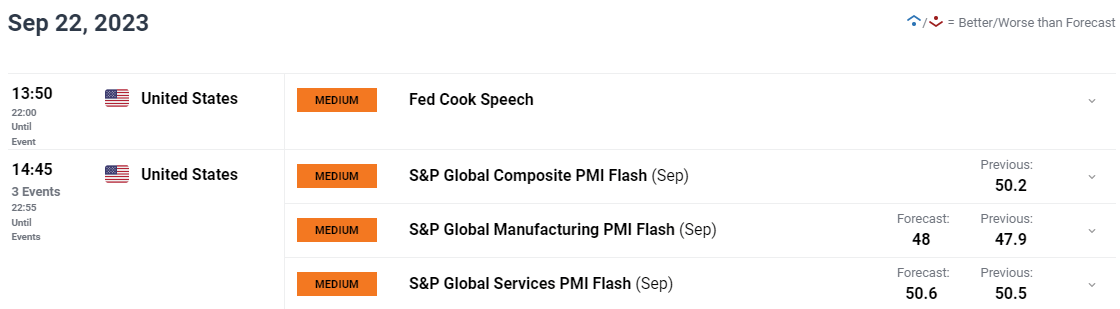
For all market-moving economic releases and events, see the DailyFX Calendar
GOLD TECHNICAL OUTLOOK
Form a technical perspective, Gold prices enjoyed a positive week heading into the FOMC meeting following a breakout of the inner descending trendline last week. The rally gathered pace in the early part of the week as the DXY stalled ahead of the Fed decision. The precious metal rallied into a key confluence zone yesterday around the $1945 handle which coincided with the Fed rate decision, before beginning its deep pullback
The pullback has gathered pace today with Gold breaking back below the 50 and currently trading below the 200-day MA resting at the $1924 mark. Having printed a lower high yesterday price action is hinting at a renewed push below the $1900 mark which could face some buying pressure around the psychological level. Below the $1900 mark though and the next key area of support is around the recent lows of $1886/oz.
As mentioned, though we continue to see ever changing sentiment and a lack of follow through from markets and this could very well continue into tomorrow and next week. With that in mind i would caution against marrying a bias at this stage as a significant beat or miss on any upcoming data could result in short-term volatility and hindering any long-term directional bias.
Gold (XAU/USD) Daily Chart – September 21, 2023
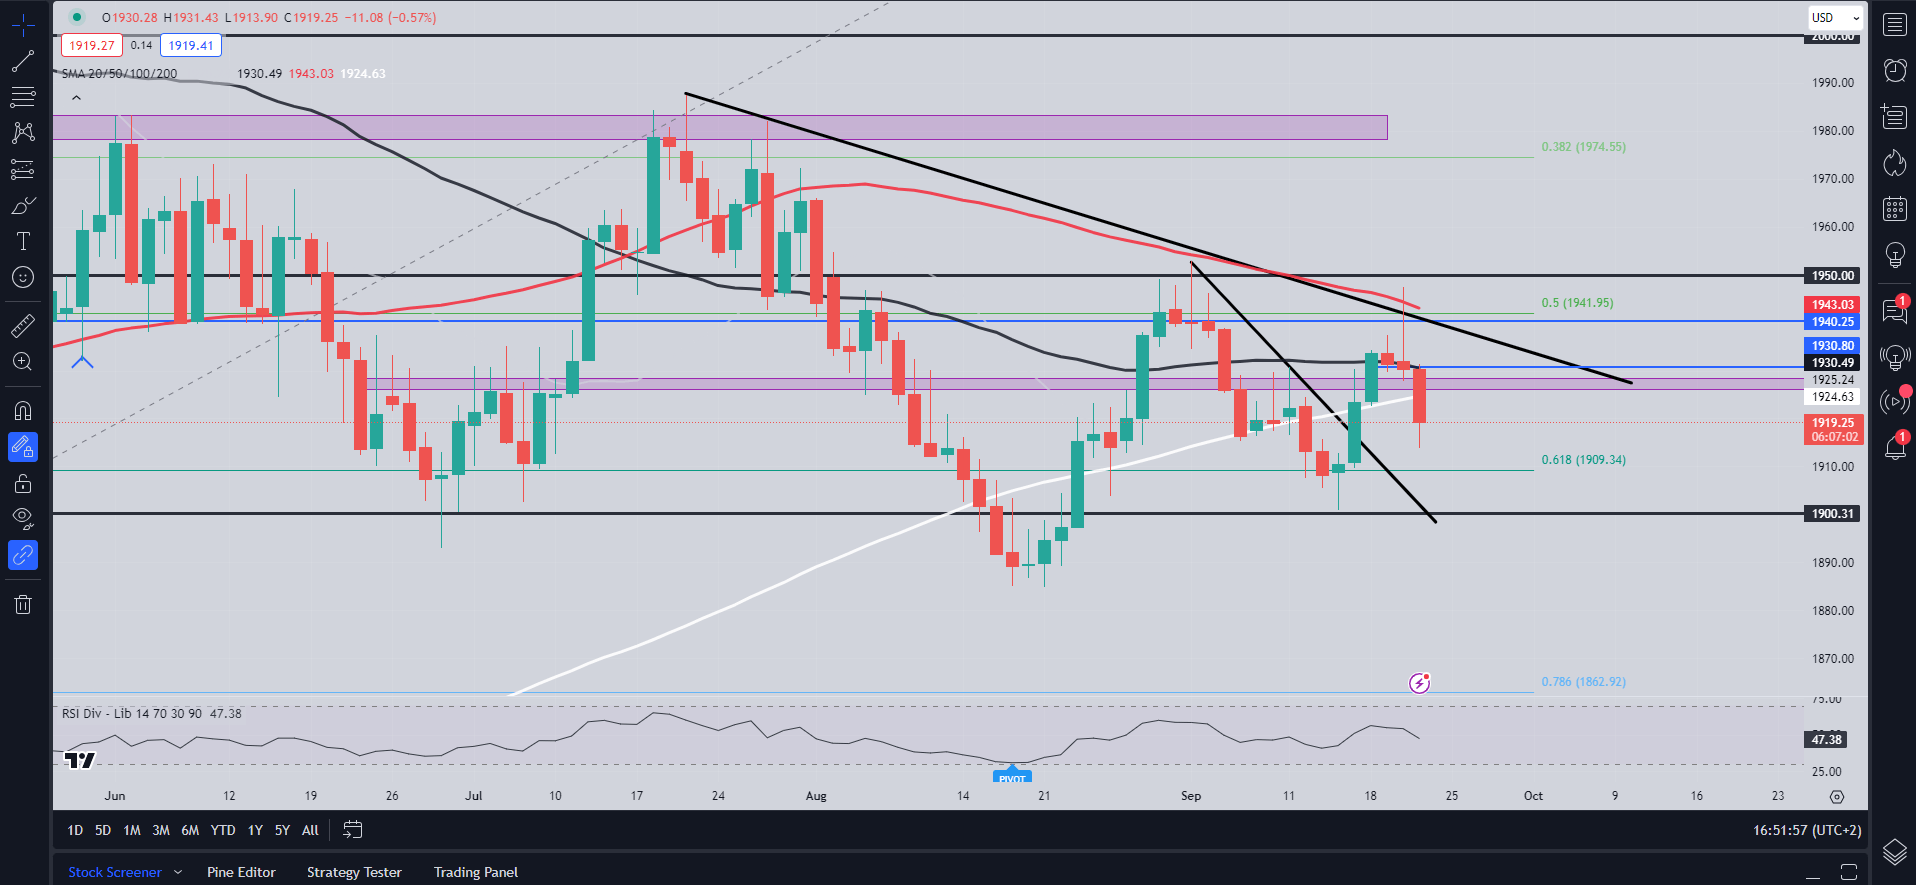
Source: TradingView, Chart Prepared by Zain Vawda
IG CLIENT SENTIMENT
Taking a quick look at the IG Client Sentiment, Retail Traders are Overwhelmingly Long on Gold with 74% of retail traders holding Long positions. Given the Contrarian View to Crowd Sentiment Adopted Here at DailyFX, is this a sign that Gold may continue to fall?
For a more in-depth look at client sentiment and ways to use it, download the complimentary guide below.
| Change in | Longs | Shorts | OI |
| Daily | 2% | 9% | 5% |
| Weekly | -2% | 1% | -1% |
Written by: Zain Vawda, Markets Writer for DailyFX.com
Contact and follow Zain on Twitter: @zvawda


