


Gold and Silver Analysis and Charts
- Central bankers pouring cold water on inflated rate cut expectations.
- Silver eyes a fresh multi-week low.
Download our brand new Gold Technical and Fundamental Forecast

Most Read: Gold Price (XAU/USD) Slipping Lower but Support Should Hold for Now
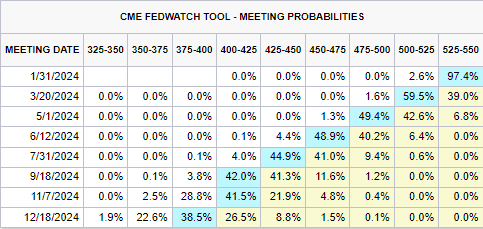
Federal Reserve and European Central Bank board members have been on the wires this week trying to temper market rate cut enthusiasm. While the firm expectation is that both central banks will cut interest rates this year, as inflation moves back towards target, the speed and amount of cuts the markets have been pricing in are at odds with the Fed and the ECB. Last week, CME FedFund expectations were pricing in seven quarter-point interest rate cuts in the US this year, starting in March. These expectations have now been pared back to six cuts, and some of these are now starting to look questionable.
For all economic data releases and events see the DailyFX Economic Calendar
Gold has struggled against this central bank headwind and is sitting on a prior level of resistance turned support at $2,009/oz. This week’s sell-off has driven the spot price through both the 20- and 50-day simple moving averages, adding to the negative tone. We noted in the article above that $2,009/oz. should hold a short-term sell-off and while this still stands, a further break lower cannot be ruled out. The next level of support at $2,000/oz. is followed by $1,987/oz. Ona longer-term basis, the chart remains positive as long as the last higher low at $1,973/oz. remains in place.
Gold Daily Price Chart
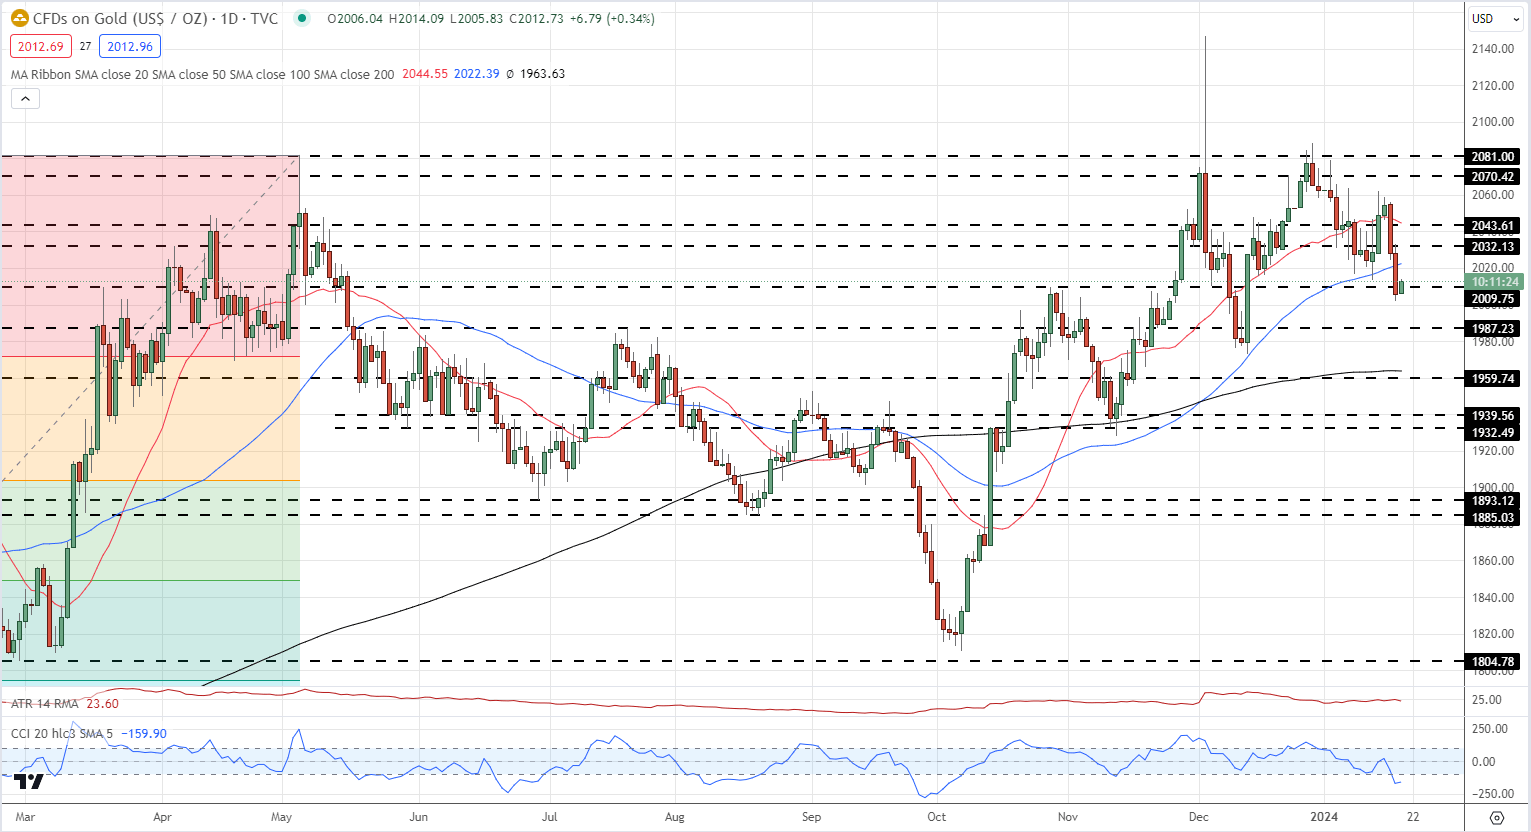
Chart via TradingView
Retail trader data shows 67.93% of traders are net-long with the ratio of traders long to short at 2.12 to 1.The number of traders net-long is 21.05% higher than yesterday and 26.39% higher than last week, while the number of traders net-short is 6.88% lower than yesterday and 15.18% lower than last week.
We typically take a contrarian view to crowd sentiment, and the fact traders are net-long suggests Gold prices may continue to fall.
See how changes in IG Retail Trader data can affect sentiment and price action.
| Change in | Longs | Shorts | OI |
| Daily | 5% | 4% | 5% |
| Weekly | 2% | -9% | -3% |
The daily silver chart looks weak with XAG/USD close to posting a fresh multi-week low. The recent series of higher lows and higher highs has been broken and further losses cannot be ruled out. The spot price is below all three simple moving averages and the 20-dsma is now below the 200-dsma, highlighting the market's current weakness.
Silver Price Daily Chart
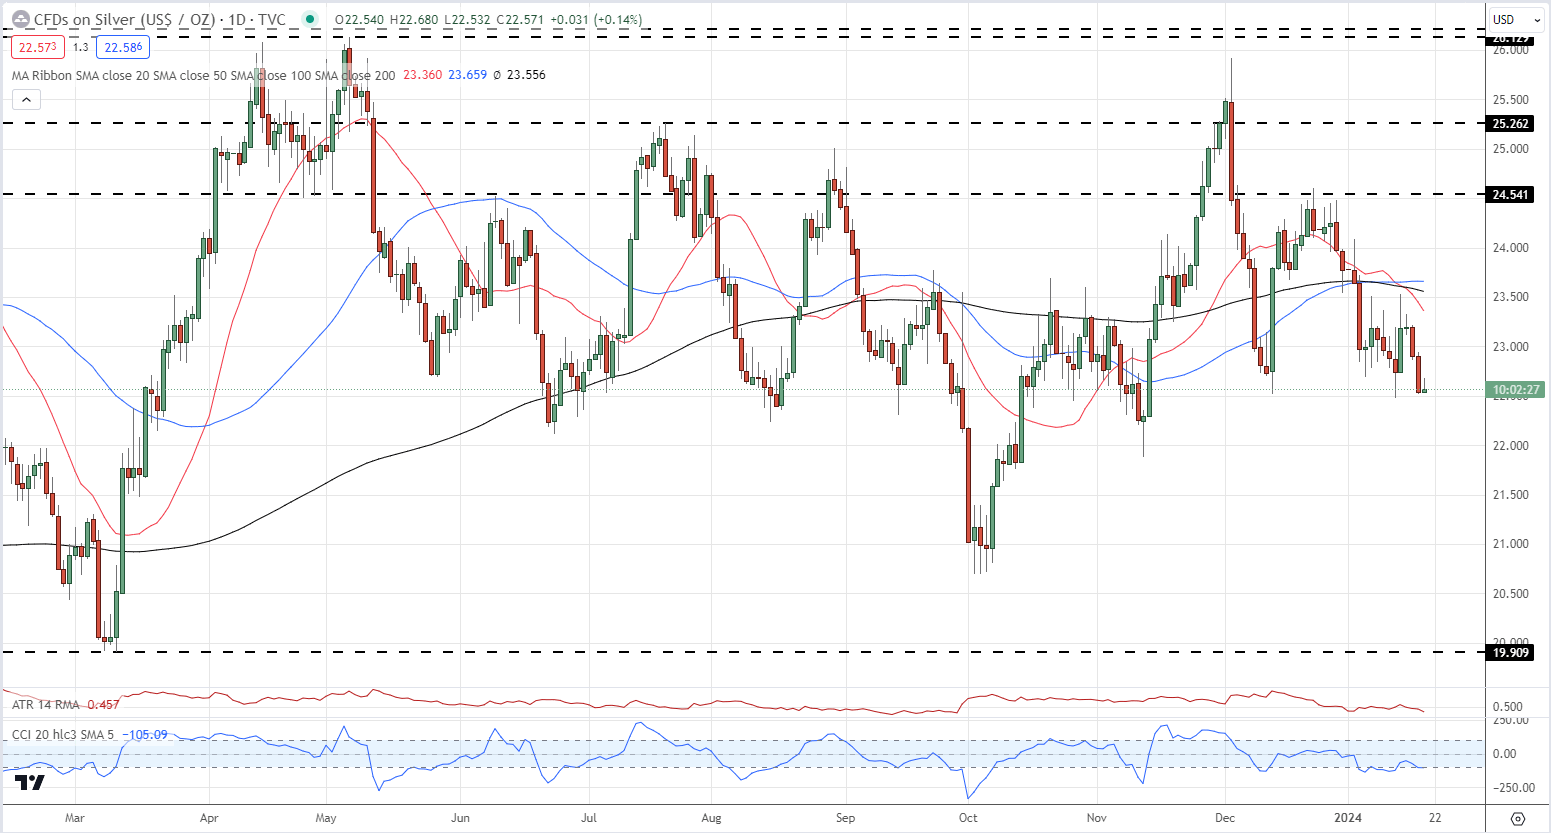
Chart via TradingView
What is your view on Gold and Silver – bullish or bearish?? You can let us know via the form at the end of this piece or you can contact the author via Twitter @nickcawley1.


