


Gold and Silver Analysis and Charts
- US warns of reprisal as Middle East tensions grow further.
- Gold and silver propped up ahead of the FOMC decision and NFPs
Most Read: Markets Week Ahead: Fed and BoE Decisions, US Jobs Data, Microsoft, Apple Amazon Report
The US has blamed Iran-backed militia for the deadly drone strikes on US service personnel at an American base in northeast Jordan with President Joe Biden pledging retaliation ‘at a time and a place of our choosing'. Iran has denied claims that it was involved in the drone attacks. There are fears that if the US responds to these attacks Iran will retaliate, escalating tensions in an already volatile Middle East environment.
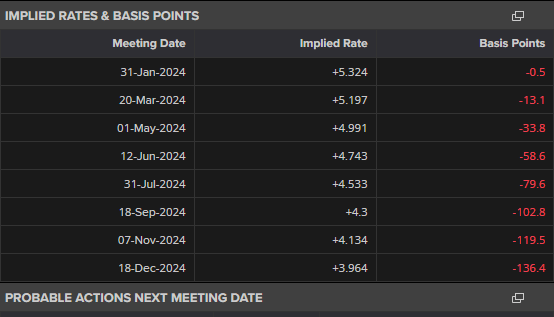
It's a busy week for commodity traders with both the Fed and the BoE policy decisions on tap while at the end of the week, the latest US Jobs Report (NFP) is released. Financial markets are currently pricing in a near 50/50 chance of a 25 basis point interest rate cut at the March 20th FOMC meeting with around 136bps of cuts seen in total this year.
For all economic data releases and events see the DailyFX Economic Calendar
Learn How to Trade Gold with our Complimentary Guide

Gold has been stuck in a narrow $38/oz. range for the last 12 days with neither buyers nor sellers taking control of price action. This stalemate is likely to continue until Wednesday’s FOMC decision unless Middle East tensions ratchet up further, and it is the post-decision press conference that will be the next driver of price action. While Chair Jerome Powell is unlikely to give a firm timetable as to when rate cuts will start, his language may give the markets a hint of future action. Until then, gold is likely to stay in a sideways pattern.


Gold Daily Price Chart
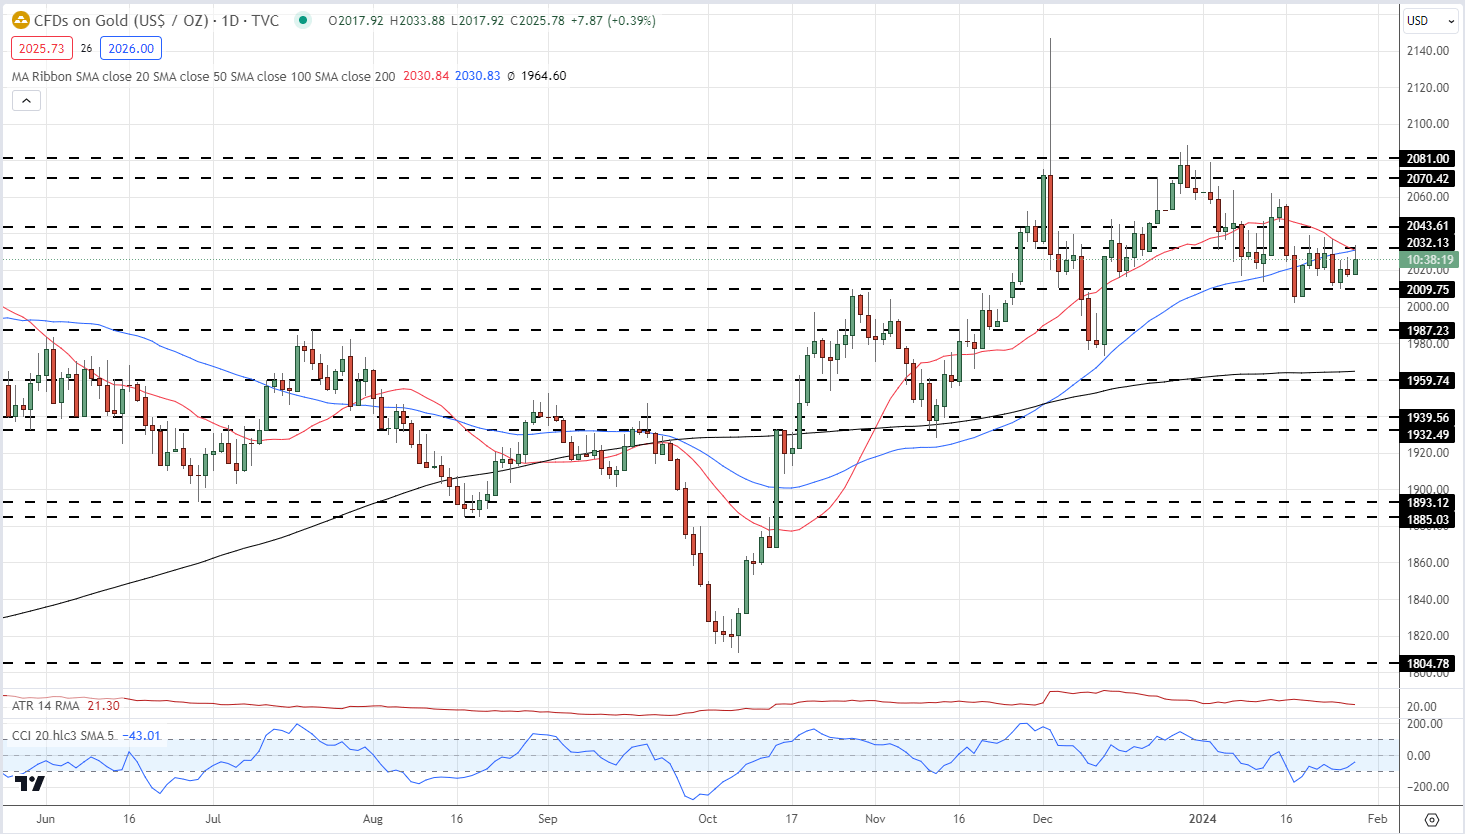
Chart via TradingView
Retail trader data show 61.96% of traders are net-long with the ratio of traders long to short at 1.63 to 1.The number of traders net-long is 1.97% higher than yesterday and 6.24% lower from last week, while the number of traders net-short is 6.17% higher than yesterday and 5.91% lower from last week.
We typically take a contrarian view to crowd sentiment, and the fact traders are net-long suggests Gold prices may continue to fall.
See how daily and weekly changes in IG Retail Trader data can affect sentiment and price action.
| Change in | Longs | Shorts | OI |
| Daily | -14% | 12% | -2% |
| Weekly | -8% | 13% | 2% |
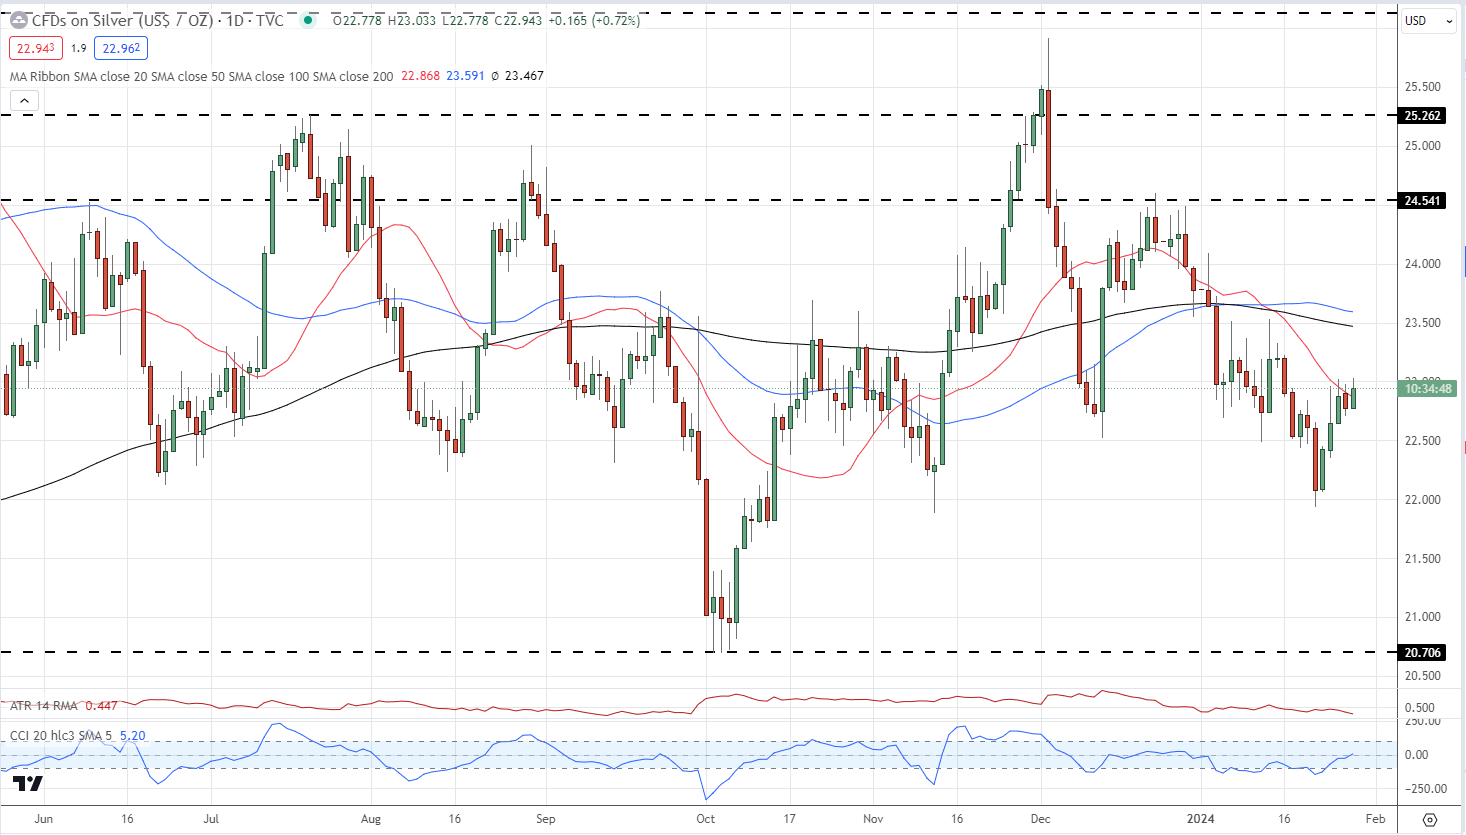
After weeks of underperforming gold, silver has put in a better shift over the last week and pared some of its recent losses. The daily chart still looks negative but if silver can break back above the 20-day simple moving average, further losses are likely to be contained. A cluster of prior highs and the 50- and 200-day moving averages on either side of $23.50 will cap any potential rally.
Silver Price Daily Chart
What is your view on Gold and Silver – bullish or bearish?? You can let us know via the form at the end of this piece or you can contact the author via Twitter @nickcawley1.


