Article by IG Senior Market Analyst Axel Rudolph
FTSE 100, DAX 40, S&P 500 - Analysis and Charts

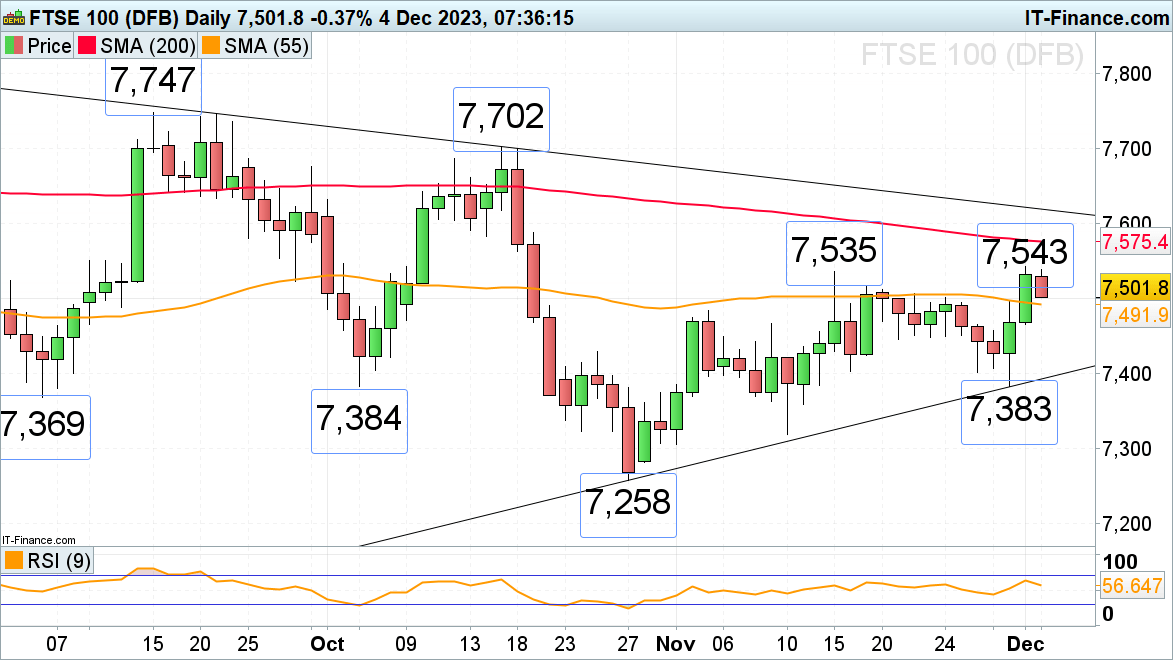
FTSE 100 comes off six-week high
The FTSE 100 is seen coming off last week’s six-week high at 7,543 as investors await more data this week to guide the economic and monetary policy outlook.
The 55-day simple moving average (SMA) at 7,492 may be revisited, together with the early November high at 7,484. While Friday’s low at 7,466 underpins, the recent overall upside pressure should remain intact. Failure there would put the major 7,384 to 7,369 September, early October, and late November lows back on the cards.
Key resistance remains to be seen at the November and current December highs at 7,535 to 7,543. Above it meanders the 200-day simple moving average (SMA) at 7,575.
FTSE 100 Daily Chart
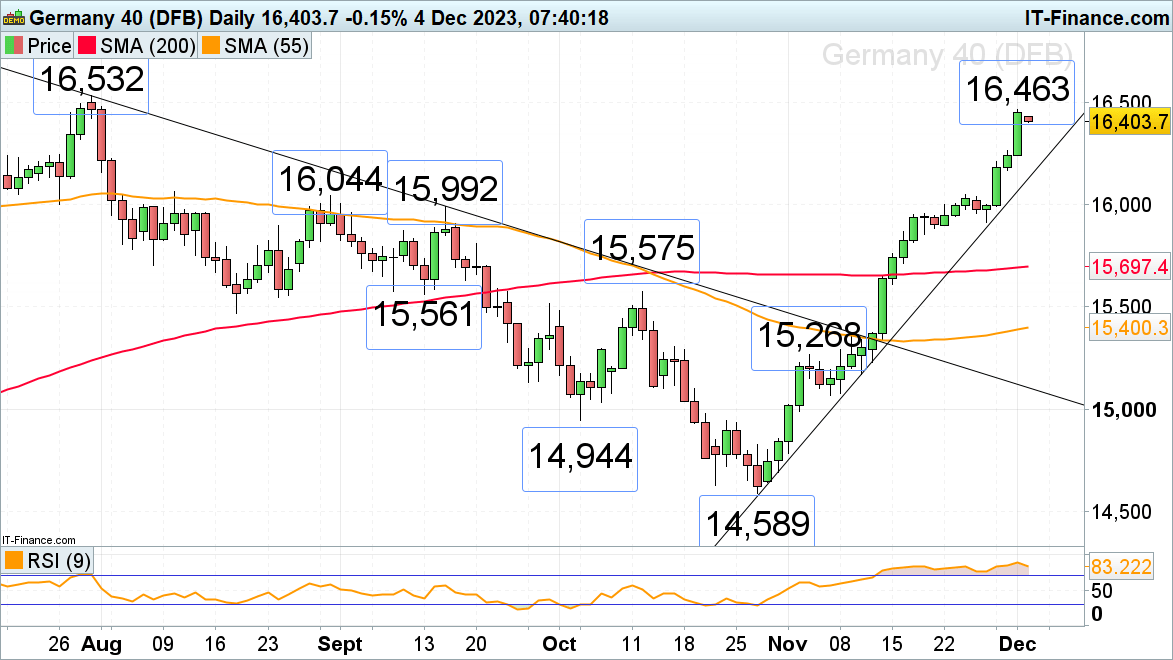
DAX 40 nears July peak
The DAX 40 continues to rally following softer German and eurozone inflation data last week. The index is getting ever closer to its 16,532 July peak around which it is likely to at least short-term stall. If not, a new all-time record high will be made.
Immediate upside pressure will be maintained while no slip through Friday’s low at 16,237 is seen. Below it lies last Thursday’s 16,165 low. More significant support can be seen between the August and September highs at 16,044 to 15,992.
DAX 40 Daily Chart
Download our Complimentary DAX 40 Sentiment Report
| Change in | Longs | Shorts | OI |
| Daily | 8% | 6% | 7% |
| Weekly | 11% | -6% | -1% |
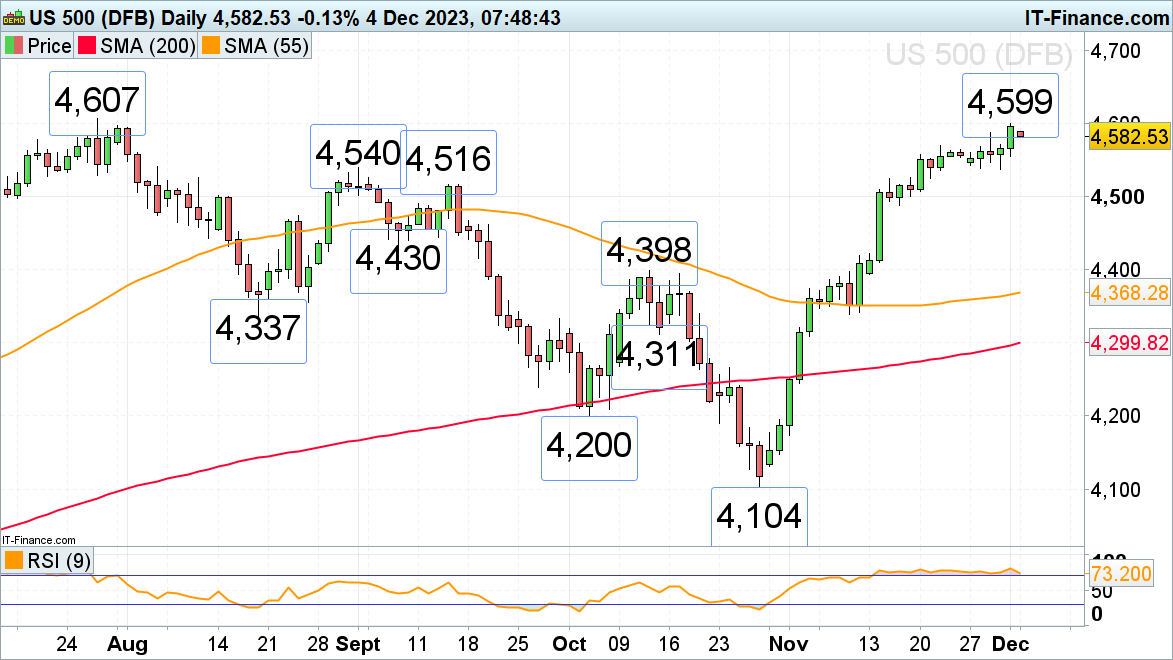
S&P 500 approaches July high
The November advance in the S&P 500 is ongoing with the July peak at 4,607 being within reach despite US Treasury yields regaining some of their recently lost ground. Around this high, the index may short-term consolidate. Once overcome, though, the March 2022 peak at 4,637 will be in focus.
Minor support can be seen at the 22 November high at 4,569 and more important support between last week’s lows at 4,539 to 4,537. Slightly further down sits support at the 4,516 mid-September high.
S&P 500 Daily Chart