Article by IG Senior Market Analyst Axel Rudolph
FTSE 100, S&P 500, Russell 2000 Analysis and Charts
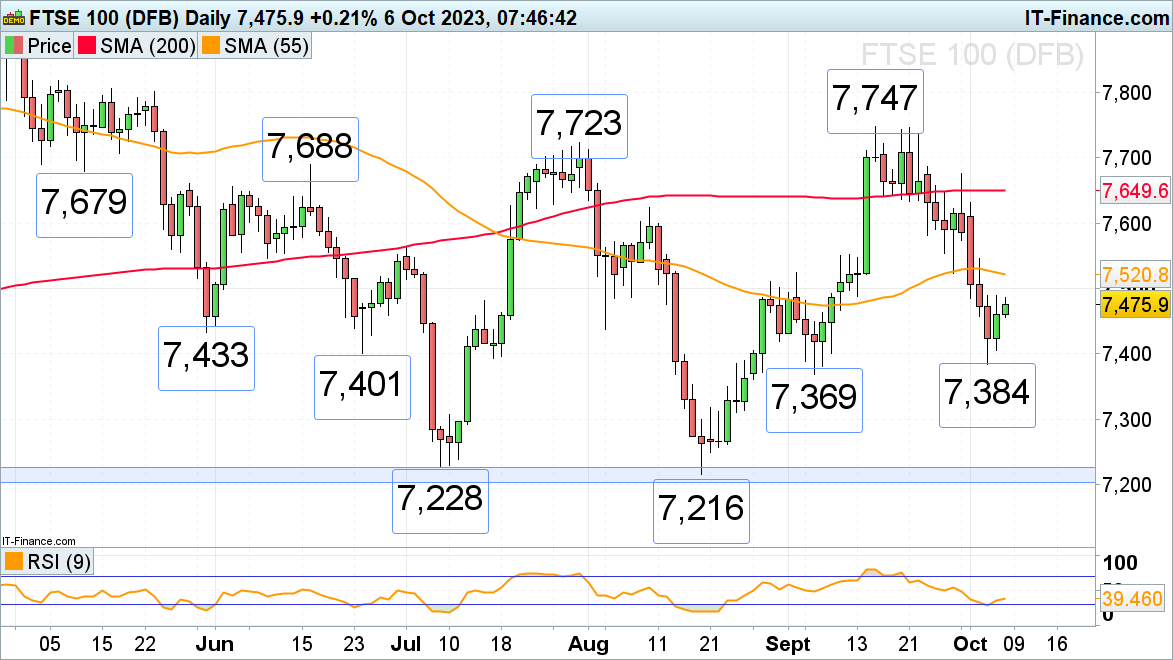
FTSE 100 tries to recover from one-month low
The FTSE 100 is seen heading back up towards its 55-day simple moving average (SMA) at 7,521 while awaiting key US employment data.If overcome, another attempt at reaching the 200-day simple moving average (SMA) at 7,650 could be made over the coming weeks.
Support below Thursday’s 7,405 low sits at Wednesday’s 7,384 trough, made marginally above the early September low at 7,369 which may also offer support.
FTSE 100 Daily Chart
Download our Brand New Q4 Equity Outlook for Free

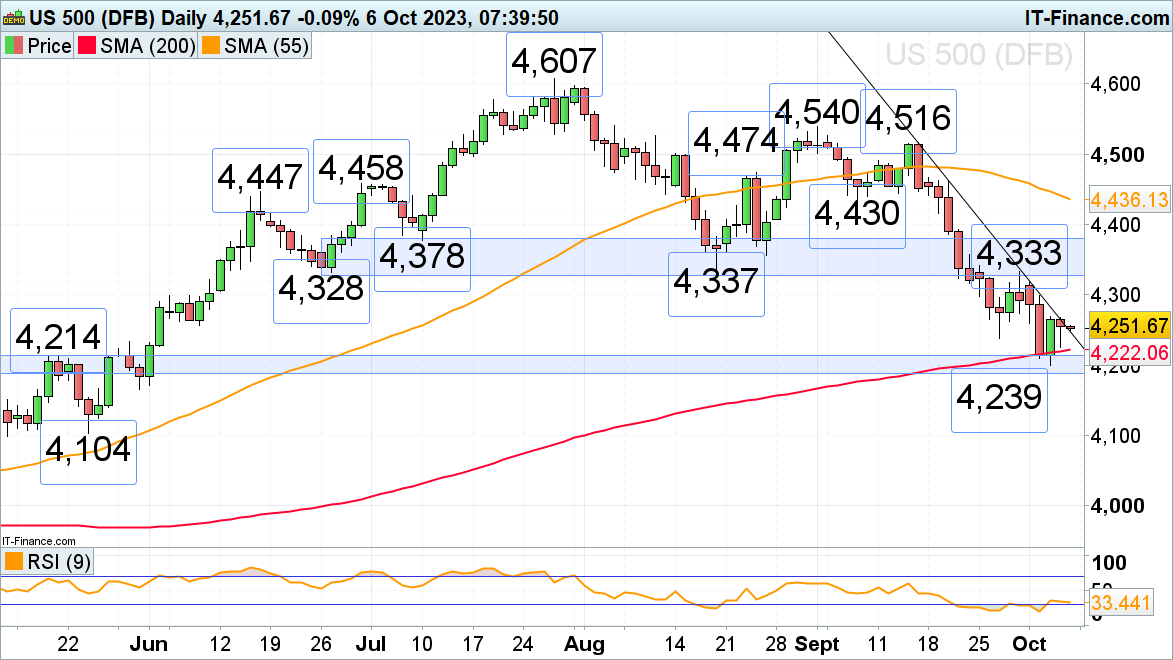
S&P 500 awaits NFP above major support
The S&P 500 continues to hover above its 4,222 to 4,187 key support zone which contains the early and late May highs and the 200-day simple moving average (SMA) ahead of Friday’s US employment report. A rise above Thursday’s high at 4,268 could lead to the 4,328 to 4,337 late June and August lows being reached, together with the late September high at 4,333. There the index is likely to stall, though.
A currently unexpected fall through key support at 4,222 to 4,187 would engage the late May low at 4,167.
S&P 500 Daily Chart
Learn Lessons from Top Traders

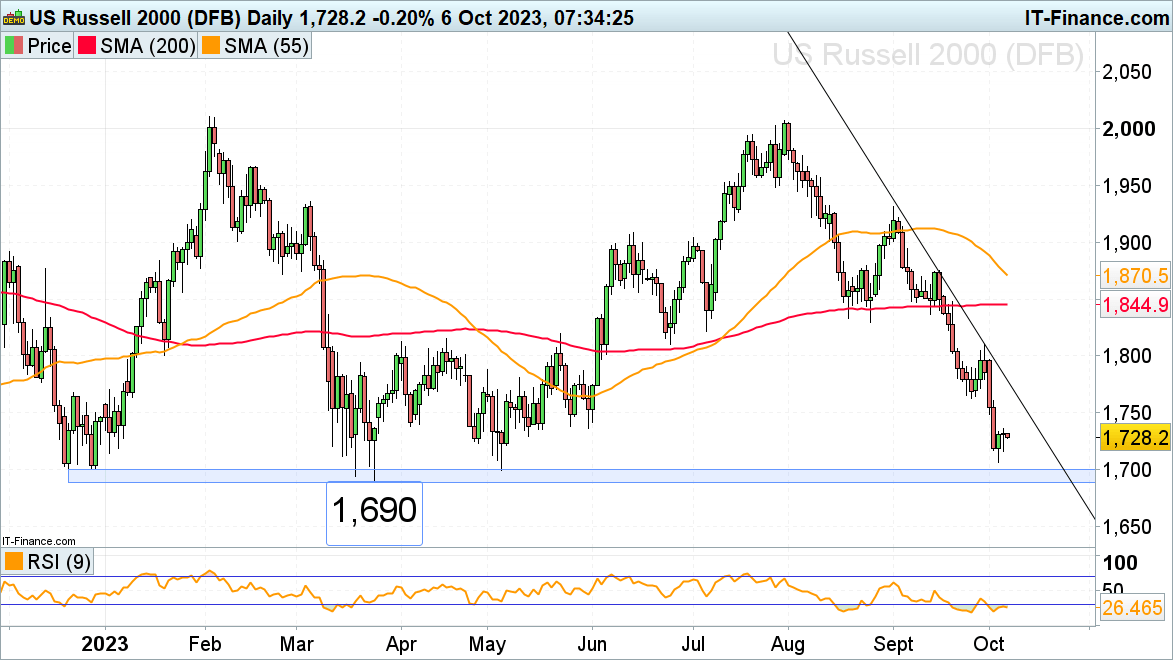
Russell 2000 hovers above key support
The Russell 2000, the great underperformer of US stock indices, with a slightly negative performance year-to-date at -1%, continues to hover above key support made up of the December 2022 to May lows at 1,700 to 1,690. Slightly retreating US yields and a sharp fall in the oil price due to lower demand could lead to a recovery rally being staged after Friday’s Non-Farm Payrolls, provided these are being interpreted as positive for equity markets.
If a rise above Thursday’s high at 1,736 were to be seen, the September-to-October downtrend line and September low at 1,763 to 1,778 may be revisited.
Were this week’s low at 1,707 to give way, the 1,700 to 1,690 major support zone would likely be retested but should then hold at least this week.
Russell 2000 Daily Chart