Article by IG Senior Market Analyst Axel Rudolph
FTSE100, DAX40, S&P 500 Analysis and Charts
FTSE 100 grinds higher
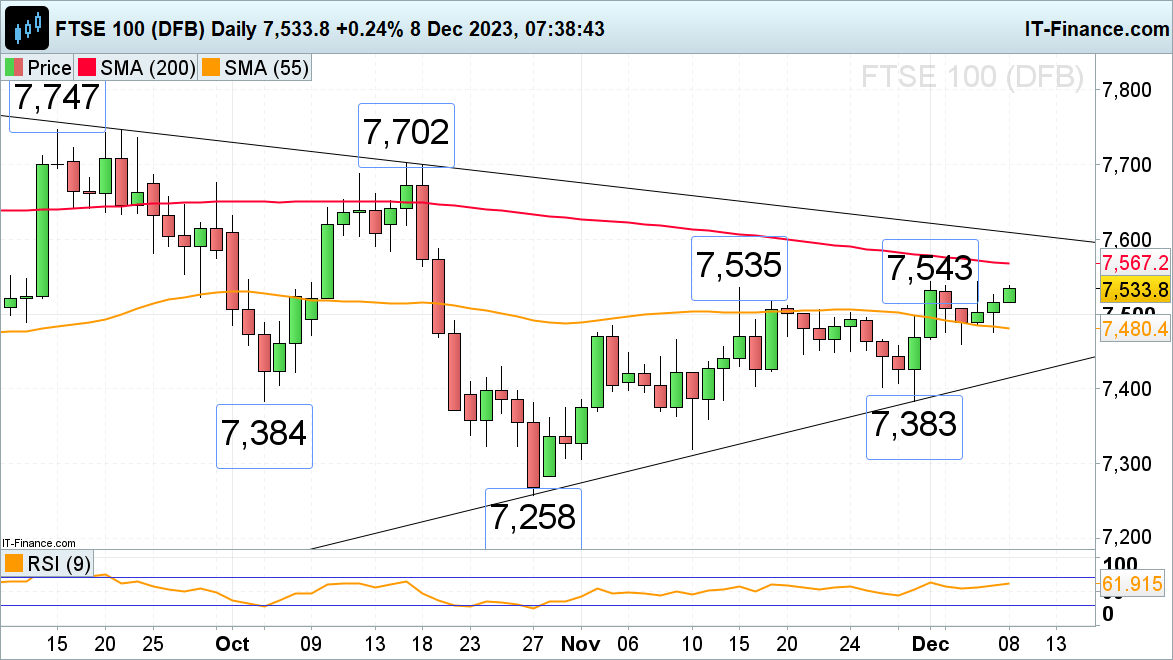
The FTSE 100 once more tries to reach this and last week’s six-week high at 7,543 as traders await US non-farm payrolls data.The UK blue chip index is being supported by the 55-day simple moving average (SMA) and Thursday’s low at 7,480 to 7,476. While this area underpins, upside pressure should be maintained. Above 7,543 meanders the 200-day simple moving average (SMA) at 7,567.
Support below the 7,480 to 7,476 sits at Tuesday’s 7,459 low.
FTSE 100 Daily Chart
Download our Complimentary Retail Sentiment Guide to Help When you Trade the FTSE 100
| Change in | Longs | Shorts | OI |
| Daily | 9% | -5% | -3% |
| Weekly | 18% | -3% | 0% |
DAX 40 is beginning to see bullish fatigue
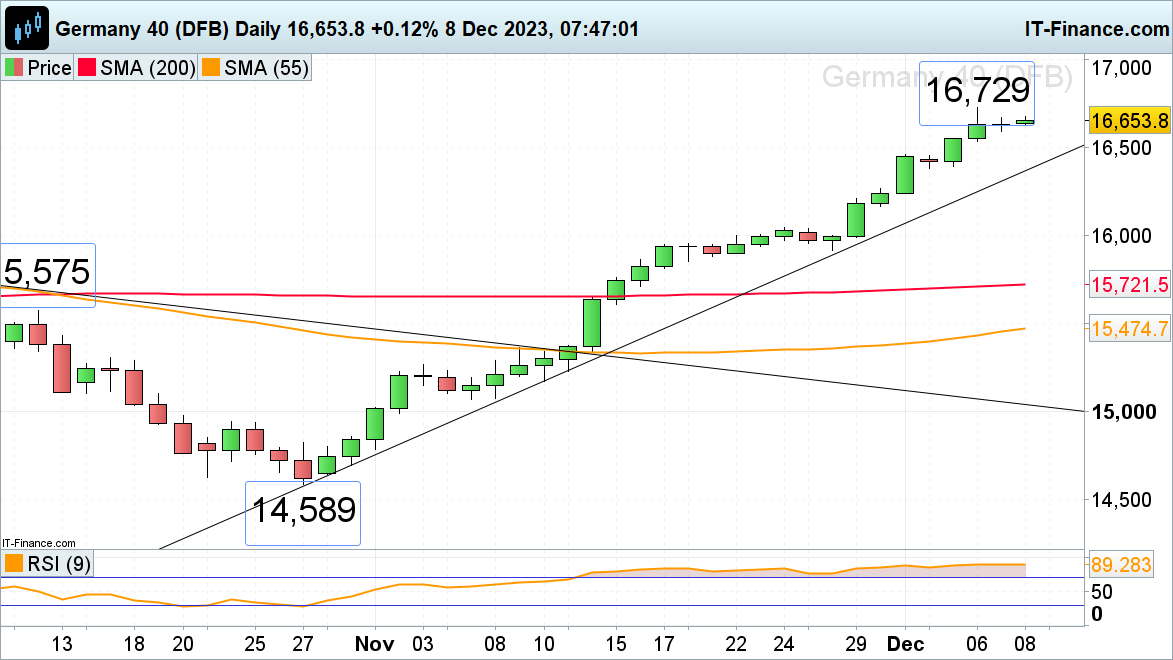
The DAX 40’s near 14% advance from its October low is slowing down amid bullish fatigue ahead of today’s US unemployment data. The German stock index hit a new all-time record high above its 16,532 July peak at 16,729 on Wednesday, getting ever closer to the minor psychological 17,000 level.
Immediate upside pressure is on the wane, though, as traders adopt a wait-and-see stance. Minor support below Thursday’s 16,594 low sits at Wednesday’s 16,544 low, ahead of last Friday’s 16,463 high.
DAX 40 Daily Chart
Learn from Other Trader's Mistakes

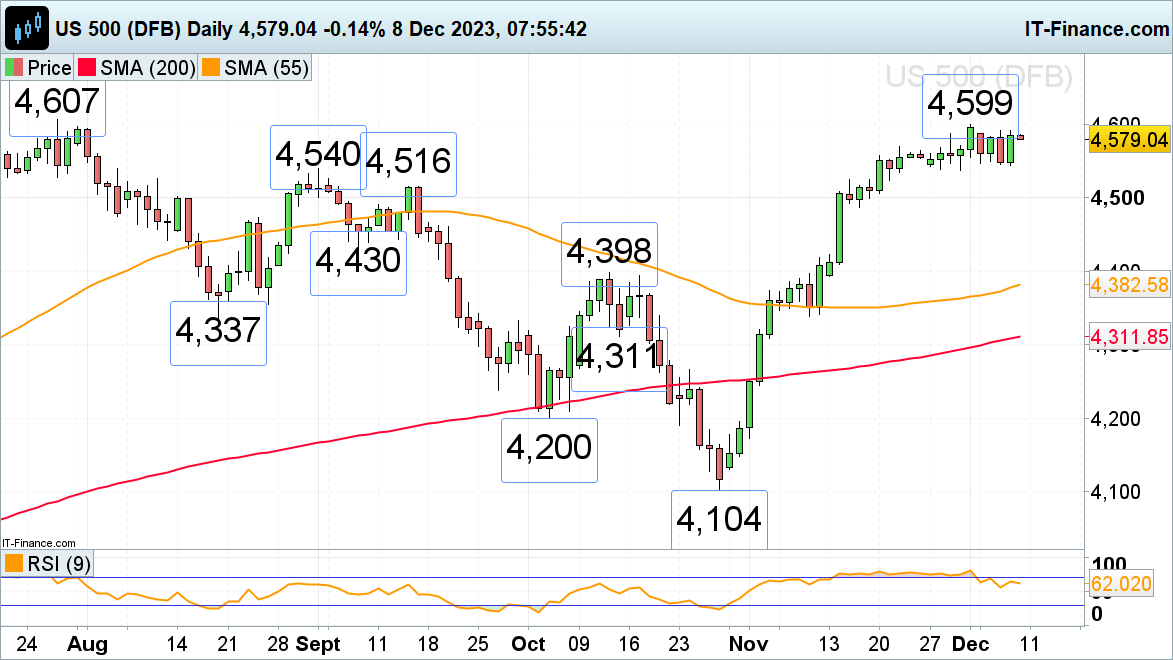
The S&P’s advance took it to 4,599 last week, to marginally below the July peak at 4,607, both of which remain in sight as traders await the publication of US unemployment data later today. While last and this week’s lows at 4,544 to 4,537 hold, the recent uptrend remains intact. Once the current sideways trading range has ended, the March 2022 peak at 4,637 would be in focus on a bullish breakout.
Immediate support can be seen at the 22 November high of 4,569. Failure at 4,544 to 4,537 would lead to the 4,516 mid-September high being targeted, though.
S&P 500 Daily Chart