Article by IG Chief Market Analyst Chris Beauchamp
FTSE 100, DAX 40, S&P 500 Analysis and Charts
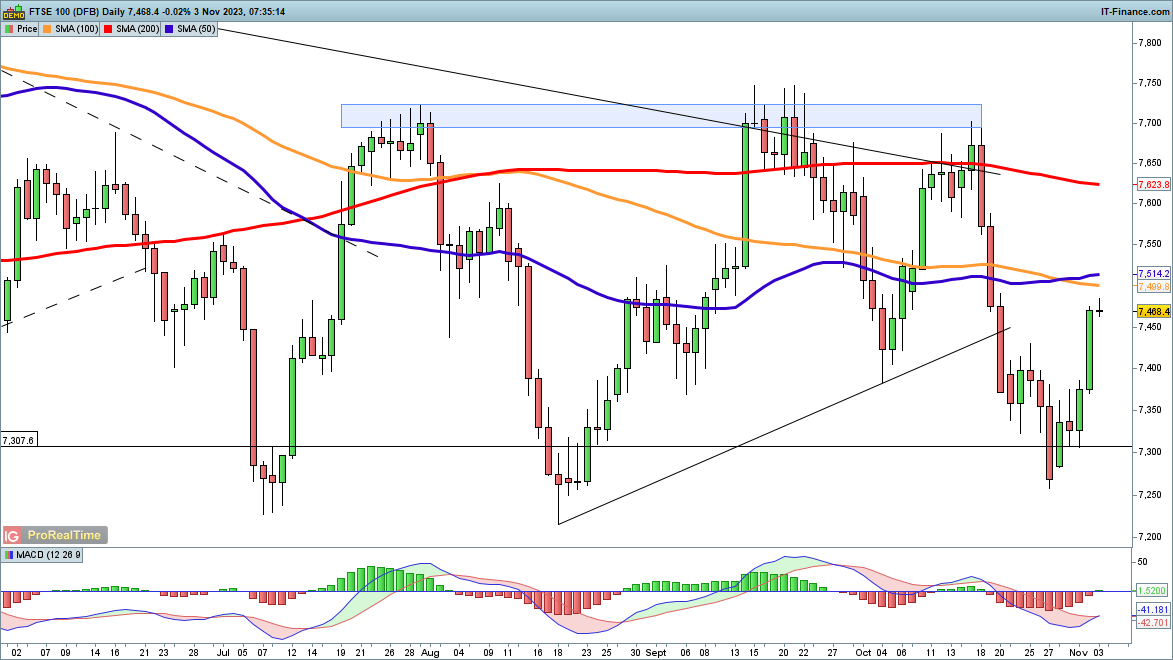
FTSE 100 in bullish short-term form
The rally off the 7300 continued on Thursday, with impressive gains for the index that have resulted in a move back through 7400. This now leaves the index on the cusp of a bullish MACD crossover, and could now see the price on course to test the 200-day SMA, and then on to 7700.
A reversal back below 7320 would negate this view.
FTSE 100 Daily Chart
| Change in | Longs | Shorts | OI |
| Daily | 7% | -5% | -3% |
| Weekly | 3% | 4% | 4% |
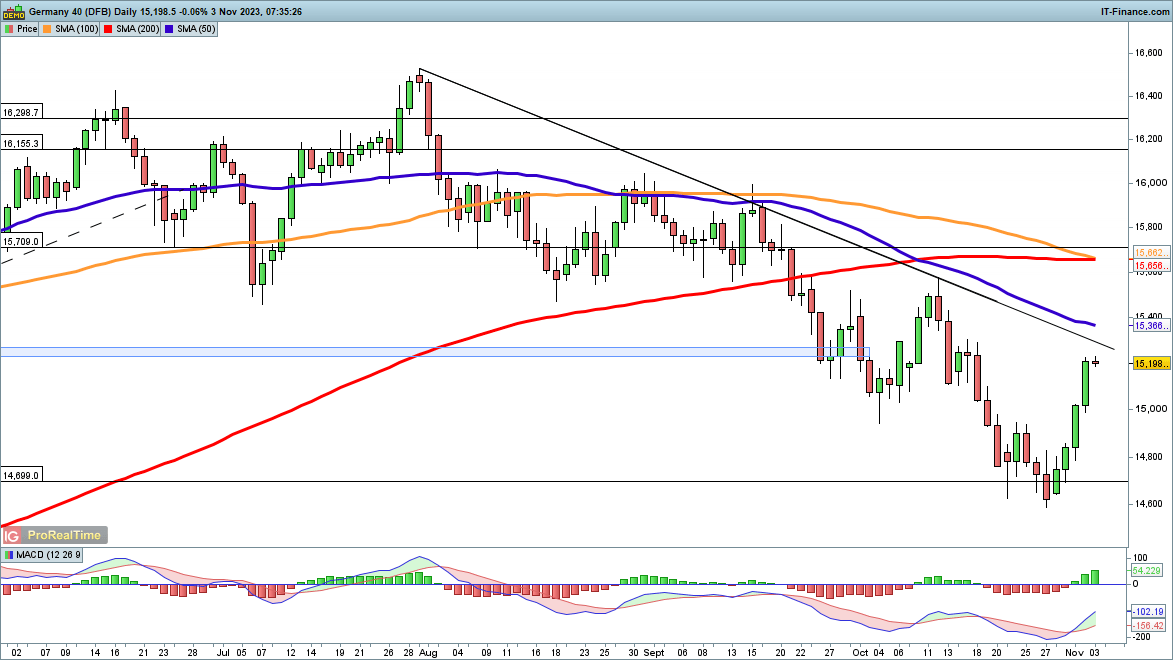
Dax 40 at two-week high
The index made big gains for a second consecutive day, and with a fresh bullish MACD crossover the buyers appear to be firmly in charge.The next stop is trendline resistance from the August record high, and then on the declining 50-day SMA, which the index has not challenged since early September.
A failure to break trendline resistance might dent the bullish view, though a close below 15,000 would be needed to give a firmer bearish outlook. This would then put the lows of October back into view.
DAX 40 Daily Chart
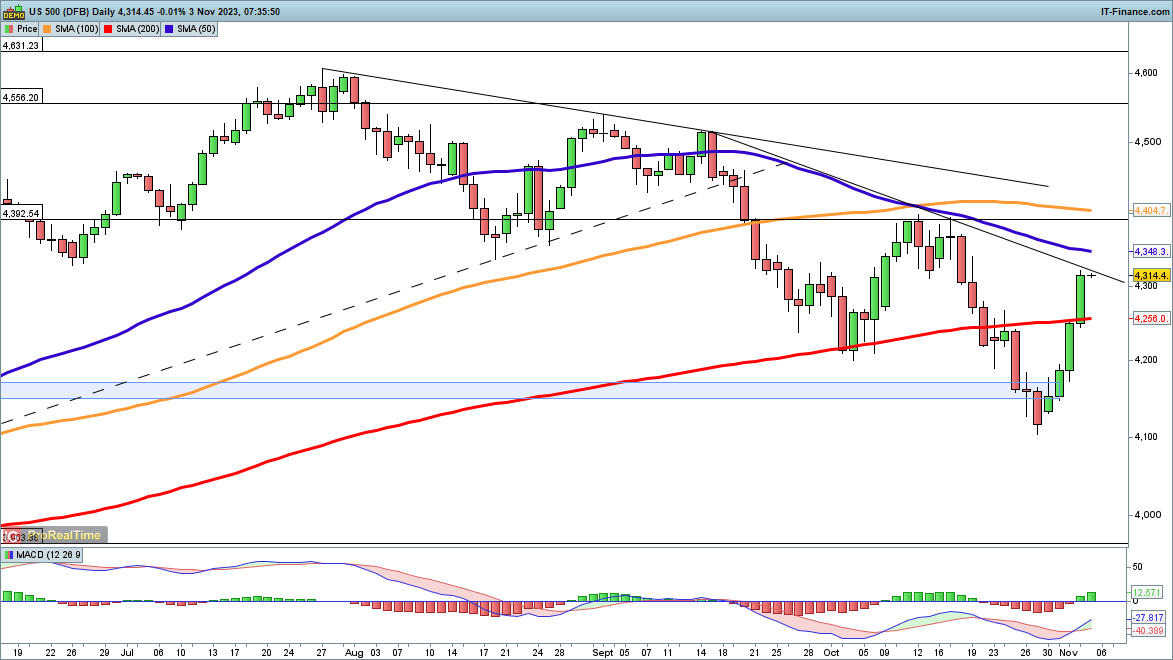
S&P 500 in strong form ahead of non-farm payrolls
The index has recouped a significant amount of the losses suffered in October, and like the Dax is now barrelling towards trendline resistance and then the 50-day SMA.Beyond these lies the 4392 peak from early October, and a close above here would solidify the bullish view.
A reversal back below the 200-day SMA would signal that the sellers have reasserted control and that a move back towards 4100 could be underway.
S&P 500 Daily Chart