Article by IG Senior Market Analyst Axel Rudolph
FTSE 100, DAX 40, S&P 500 Analysis and Charts
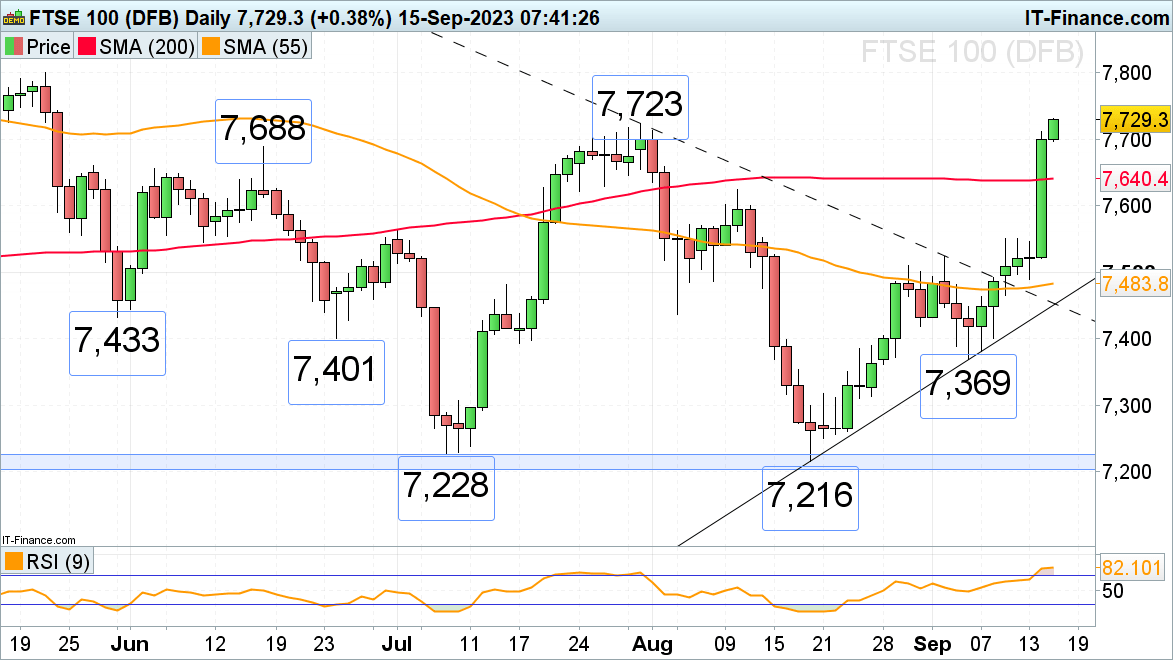
FTSE 100 rallies to 3 ½ month high
The FTSE 100 had one of its best days this year and rose by 2% on the rising oil price and as mining stocks rallied after China cut its reserve requirements for the second time this year. The UK blue chip index now trades at levels last seen in May on its way to the psychological 7,800 mark and the 7,817 8 May high.
Potential slips should find support around the 7,688 to 7,679 June high and mid-May low, ahead of the 200-day simple moving average at 7,640.
FTSE 100 Daily Chart
See the Latest FTSE 100 Sentiment Changes and Outlook
| Change in | Longs | Shorts | OI |
| Daily | 36% | -8% | 1% |
| Weekly | 68% | -8% | 4% |
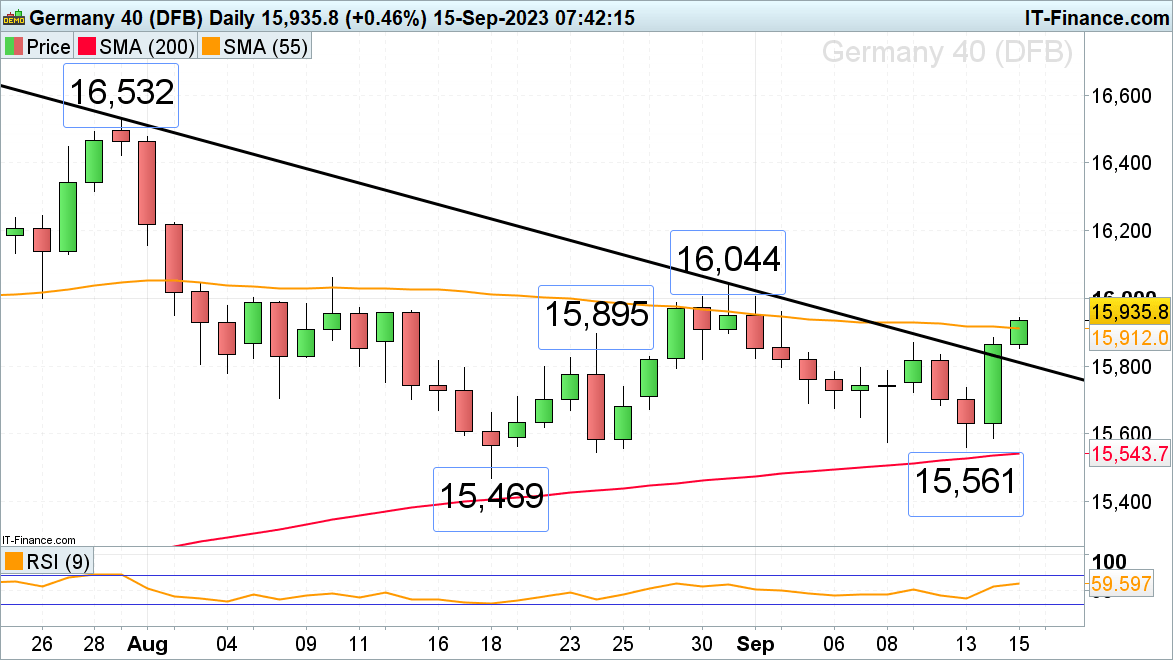
DAX 40 bottoms out
The DAX 40 benefitted from the fact that the European Central Bank (ECB) raised its deposit rate to 4% whilst announcing that it wasn’t planning any more rate hikes despite it also lowering its Eurozone growth forecasts for the years ahead.The German stock index is in the process of breaking through its 55-day simple moving average (SMA) at 15,912 with the August peak at 16,044 being eyed. This level needs to be exceeded for a medium-term bottoming formation to be confirmed. In this case, a rise back toward the July high at 16,532 may unfold until year-end.
Minor support below the 55-day SMA at 15,912 sits at Monday’s 15,871 high and can also be spotted along the breached July-to-September downtrend line, now because of inverse polarity a support line, at 15,810.
DAX 40 Daily Chart

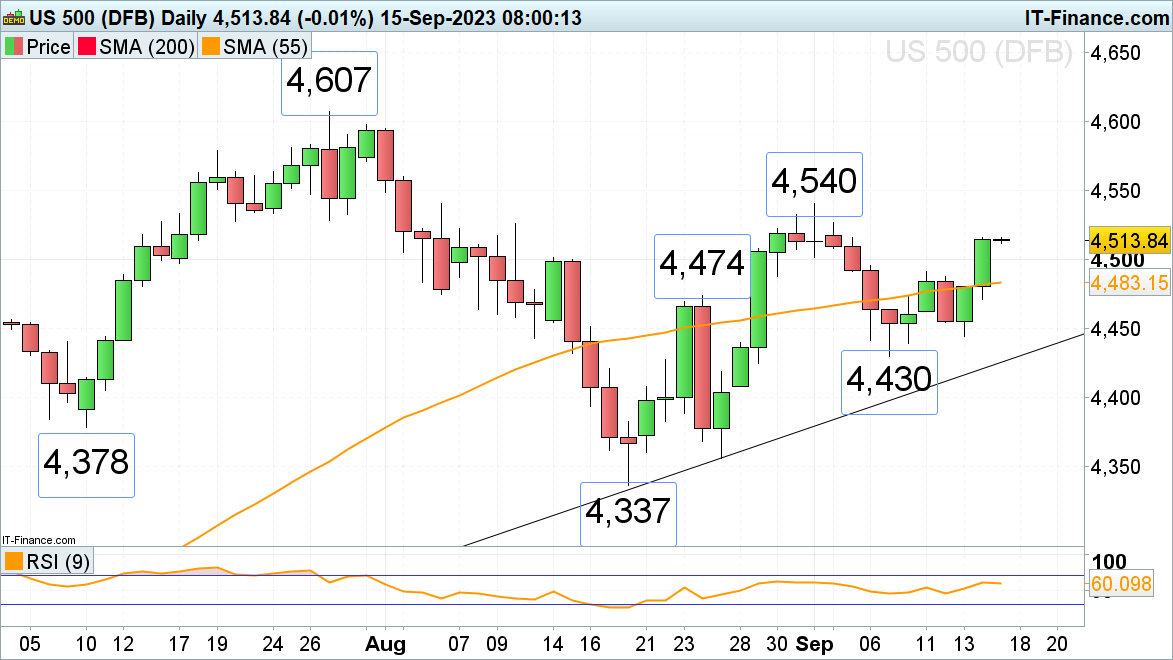
S&P 500 resumes its ascent
Following a strong finish on Wall Street on the ECB’s cautious rate hike and dovish outlook, a reduction in the reserve ratio requirement by the People's Bank of China (PBOC), and a successful Arm IPO, Asian indices benefitted from positive sentiment and, except the Shanghai Composite, ended the week on a positive note. The S&P 500 is thus back on its way to its 4,540 early September high, a rise above which would put the July peak at 4,607 on the plate.
Potential slips may find support around the 4,502 early September low ahead of Monday’s 4,491 high and the 55-day simple moving average (SMA) at 4,483 and the late August 4,474 peak.
S&P 500 Daily Chart