Article by IG senior market analyst Axel Rudolph
FTSE 100, DAX 40, S&P 500 Analysis and Charts
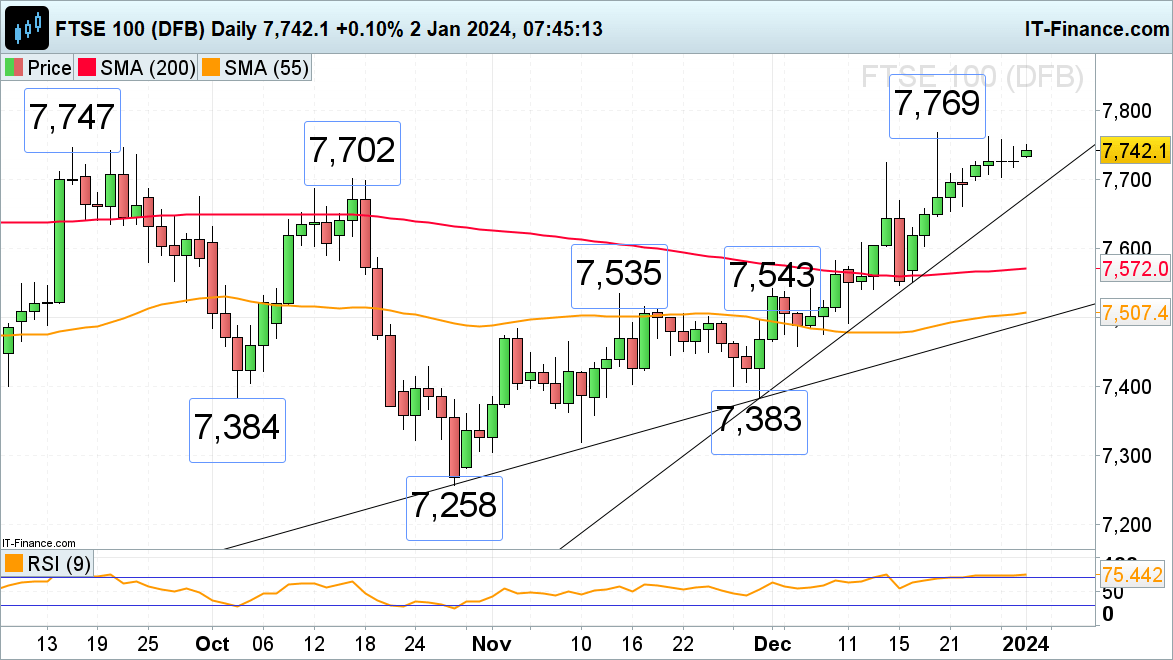
FTSE 100 aims for its September and December highs
The FTSE 100 begins the new year on a stronger footing and eyes its September and December highs at 7,747 to 7,769 despite a mixed session in Asia. While Thursday’s low at 7,705 holds, upside pressure should be maintained with the 7,747 to 7,769 region representing upside targets ahead of the 7,800 mark.
A slip through 7,705 would likely retest the 7,702 October peak below which the November-to-December uptrend line can be spotted at 7,676.
FTSE 100 Daily Chart

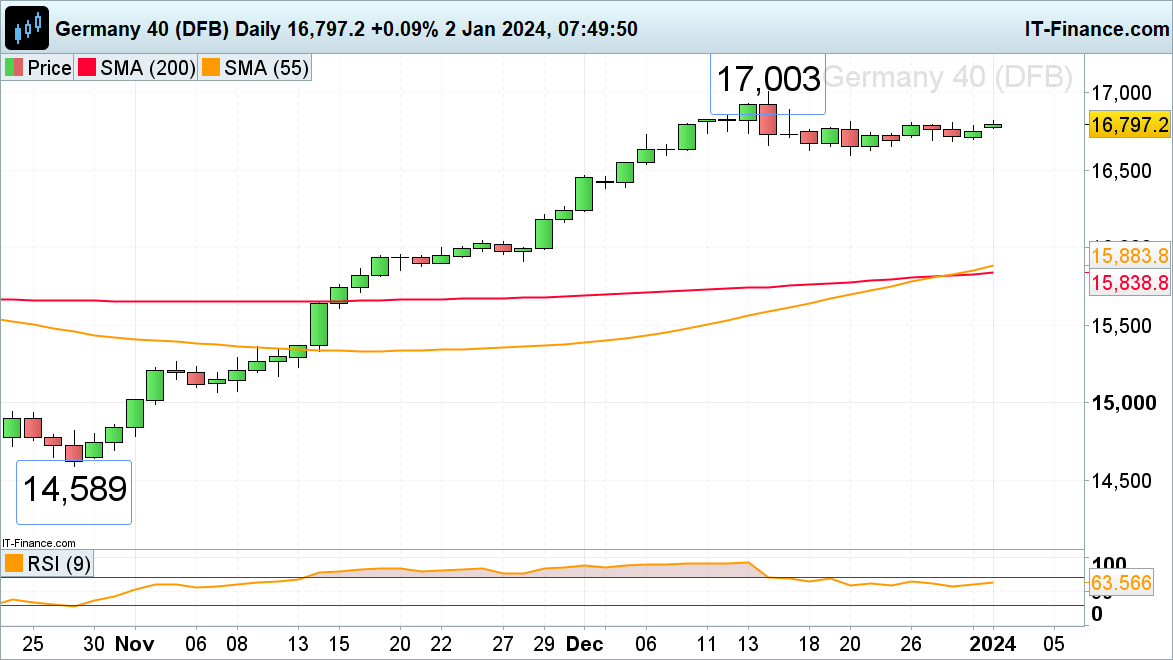
DAX 40 kicks off the new year on a positive footing
The DAX 40 index is targeting its recent highs at 16,809 to 16,812 ahead of final German PMIs. If exceeded, the December record high at 17,003 should be back in focus.
Support below Thursday’s 16,686 low lies at the 20 December 15,595 low. Only if this low were to give way, would the July peak at 16,532 be back on the map but would be expected to offer support.
DAX 40 Daily Chart
| Change in | Longs | Shorts | OI |
| Daily | -22% | -1% | -7% |
| Weekly | 13% | -11% | -5% |
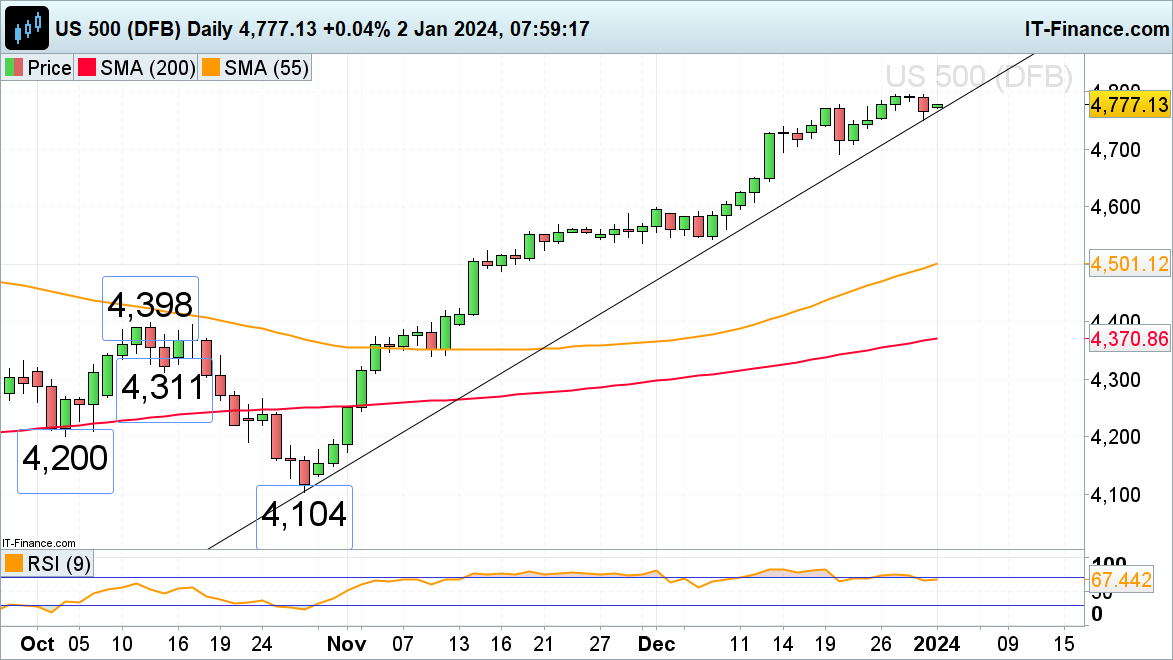
S&P 500 is beginning to show negative divergence on the daily RSI
The S&P, which has risen for nine consecutive weeks and is the most overbought in over three decades, is showing first signs of potentially topping out marginally below its January 2022 record high at 4,817. With around 50% of S&P 500 stocks trading above the 70% overbought level on their 14-day simple moving averages (SMA) and the daily Relative Strength Index (RSI) showing negative divergence, the risk of a correction lower being seen is currently high.
Potential slips through the October-to-January uptrend line and Friday’s low at 4,451, made between the November and mid-December 2021 highs at 4,752 to 4,743, could put the 20 December low at 4,692 back on the plate.
Resistance above the 20 December high at 4,778 is seen at last week’s 4,795 peak.
S&P 500 Daily Chart