Article by IG Senior Market Analyst Axel Rudolph
FTSE100, DAX 40, S&P 500 Analysis and Charts
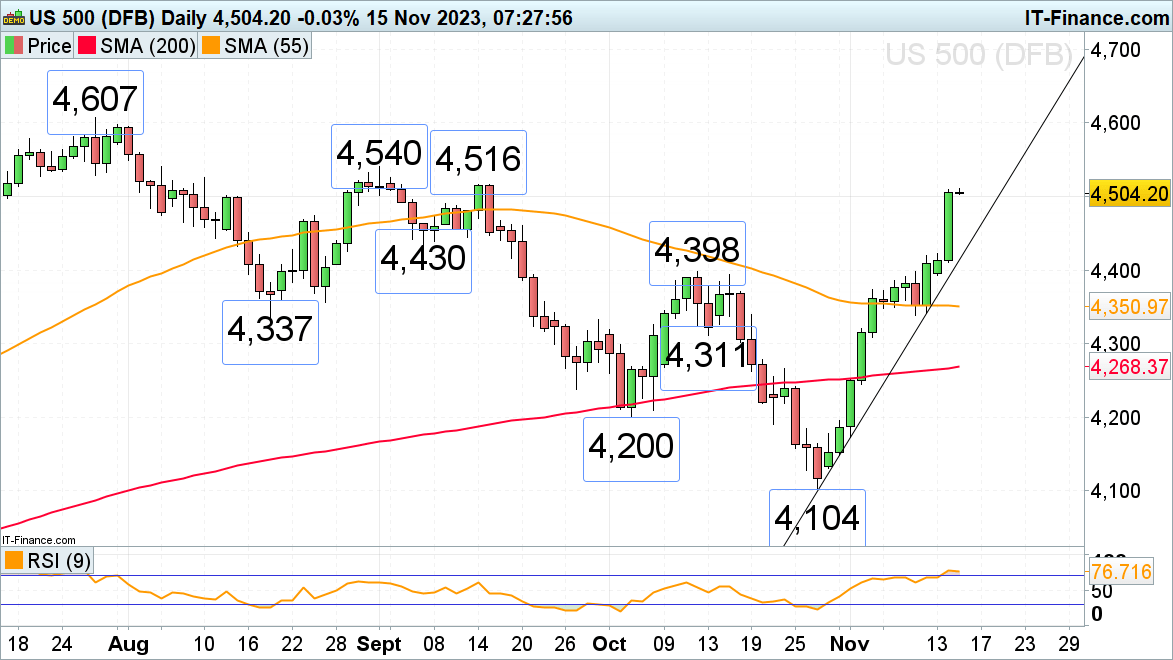
FTSE 100 rallies on softer US and UK inflation
The FTSE 100 is on track for its third consecutive day of gains on softer US and UK inflation with the early November high at 7,484 being retested. Further up beckons the 55-day simple moving average at 7,503. If exceeded, the 200-day simple moving average (SMA) at 7,606 would be back in the frame.
Support below Wednesday’s 7,430 low can be found between the breached one-month tentative downtrend line at 7,406 and the early September and early October lows at 7,384 to 7,369.
FTSE 100 Daily Chart
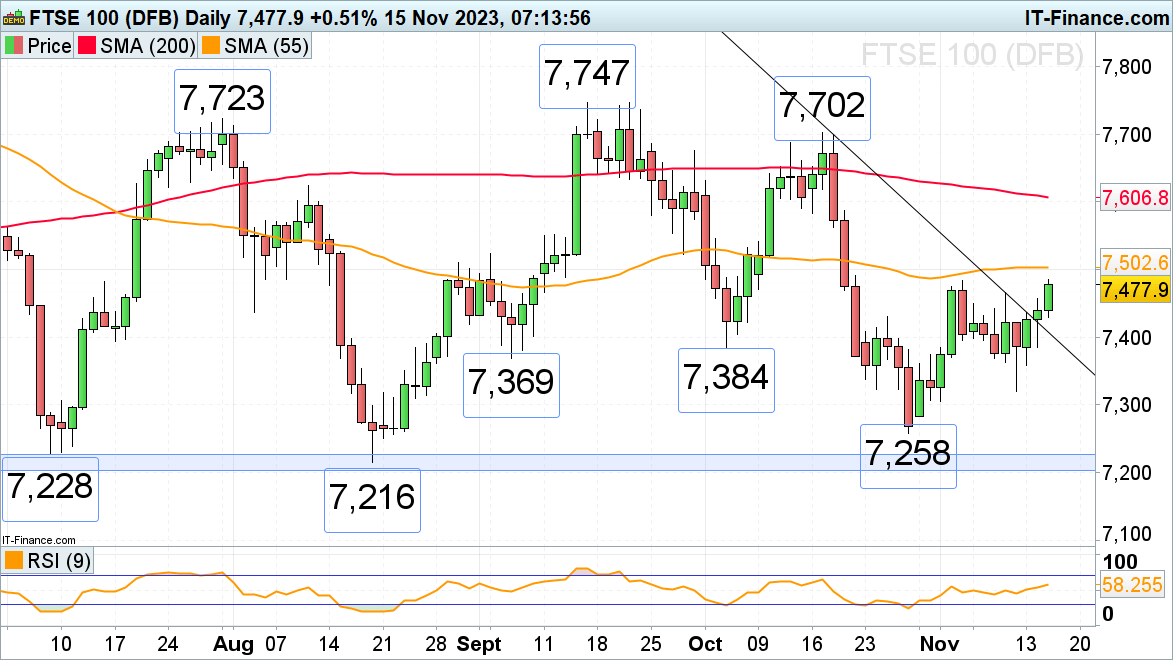

DAX 40 reaches 200-day simple moving average
The DAX 40’s rally from its 14,589 October low accelerated to the upside with the index rallying by 1.76% on Tuesday on softer US consumer price inflation (CPI) and as the German ZEW economic sentiment came in much stronger than expected. The index is now flirting with the 200-day simple moving average at 15,656 which may short-term cap. Once bettered on a daily chart closing basis, the late August and September peaks at 15,992 to 16,044 should enter the fray.
Potential slips should find support between the early October high at 15,575 and the mid-September low at 15,561. Further minor support sits at the late September 15,518 high.
DAX 40 Daily Chart
Download our Complimentary Retail Sentiment Guide
| Change in | Longs | Shorts | OI |
| Daily | 12% | 5% | 7% |
| Weekly | 15% | -10% | -3% |
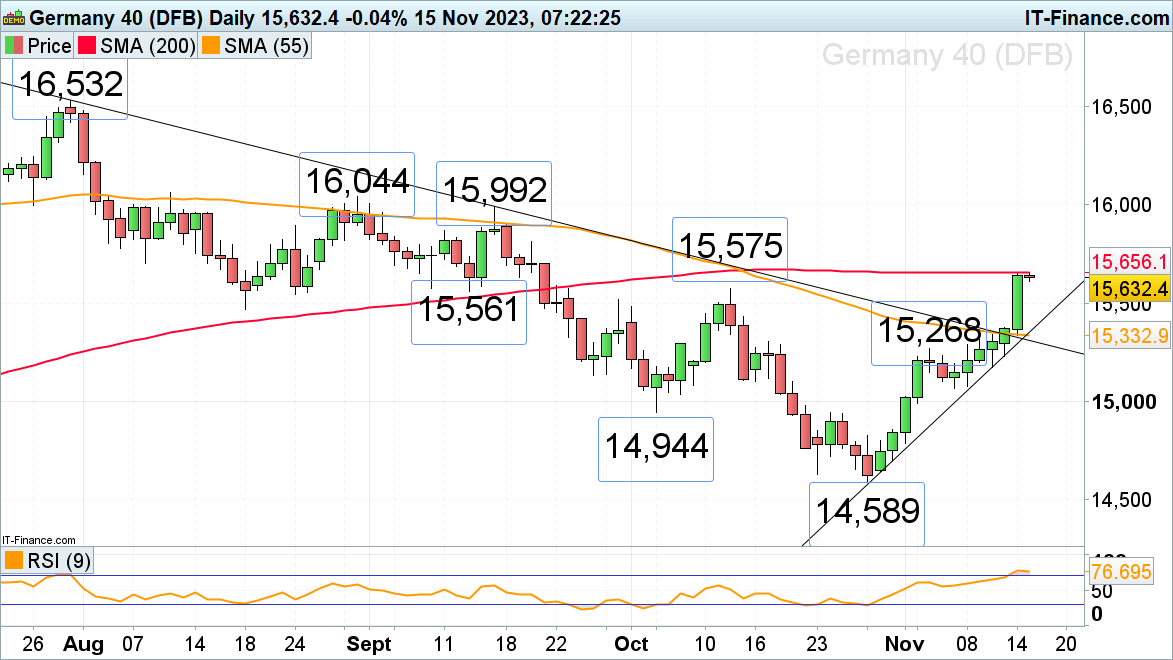
S&P 500 nears the September peak at 4,540
The sharp rally in the S&P 500 has gained even more upside momentum amid softer-than-expected US inflation data and as 10-year US treasury yields slid below the 4.50% mark. The early and mid-September highs at 4,516 to 4,540 represent the next upside targets ahead of the 4,607 July high.
Potential slips may find support around the 11 September high at 4,491 and further down around the 24 August high at 4,474.
S&P 500 Daily Chart