Article by IG Senior Market Analyst Axel Rudolph
FTSE 100, DAX 40, S&P 500 - Analysis and Charts
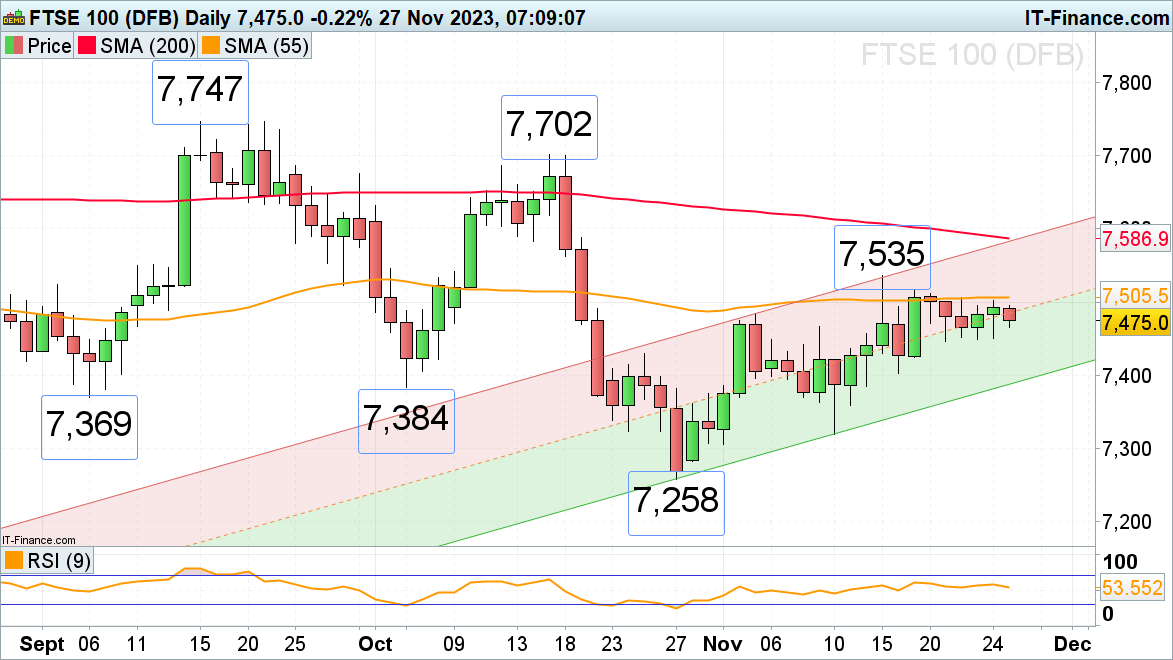
FTSE 100 remains side-lined
Last week the FTSE 100 traded sideways below the 55-day simple moving average (SMA) at 7,505, and this week is expected to continue to do so, at least for a few more days. While the UK blue chip index stays above Tuesday’s 7,446 low, though, it remains within a gradual uptrend, targeting its recent 7,516 high. If bettered, the current November peak at 7,535 will be in focus ahead of the 200-day simple moving average (SMA) at 7,587.
Below Tuesday’s 7,446 low, minor support can be seen around the mid-November low at 7,403 and the early September and early October lows at 7,384 to 7,369.
FTSE 100 Daily Chart
Download our Free FTSE 100 Sentiment Report to see how Retail Positioning can Affect the Market's Outlook
| Change in | Longs | Shorts | OI |
| Daily | 8% | -6% | -3% |
| Weekly | 6% | -1% | 0% |
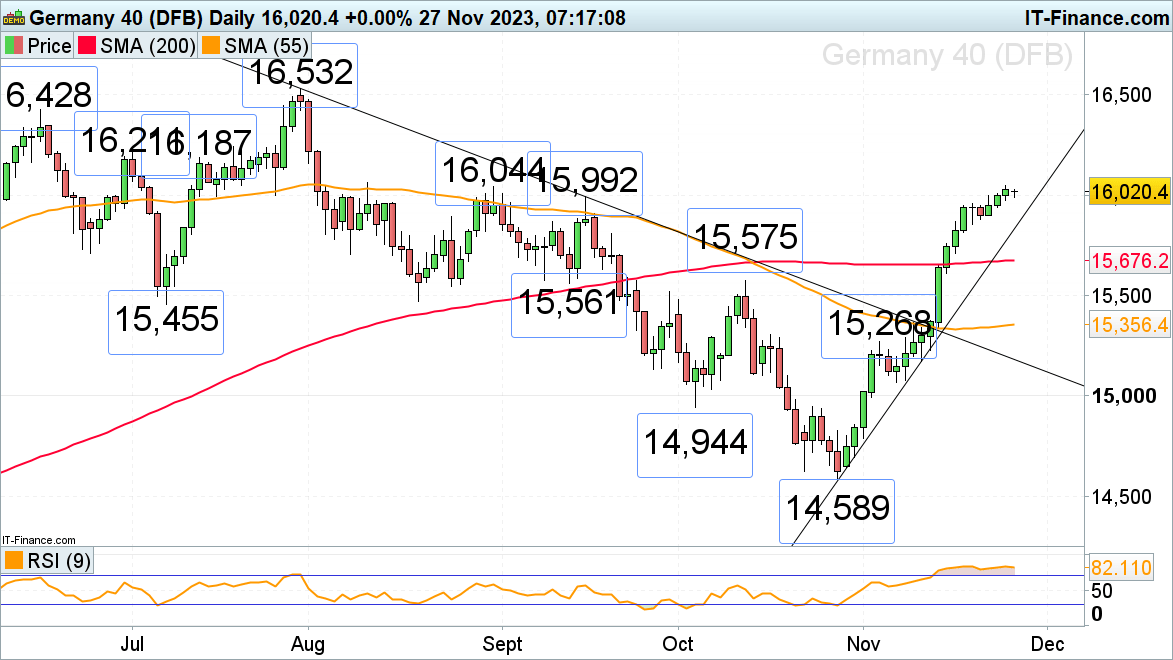
DAX 40 continues to play with the 16,000 mark
The DAX 40 continues to flirt with the psychological 16,000 mark ahead of Germany’s consumer confidence data, out on Tuesday. The August and September highs at 15,992 to 16,044 thus continue to act as a short-term resistance zone. If overcome, the early and mid-July highs at 16,187 to 16,211 would be targeted next.
Minor support is seen around last Monday’s high at 15,955 and at Tuesday’s 15,880 low.
DAX 40 Daily Chart

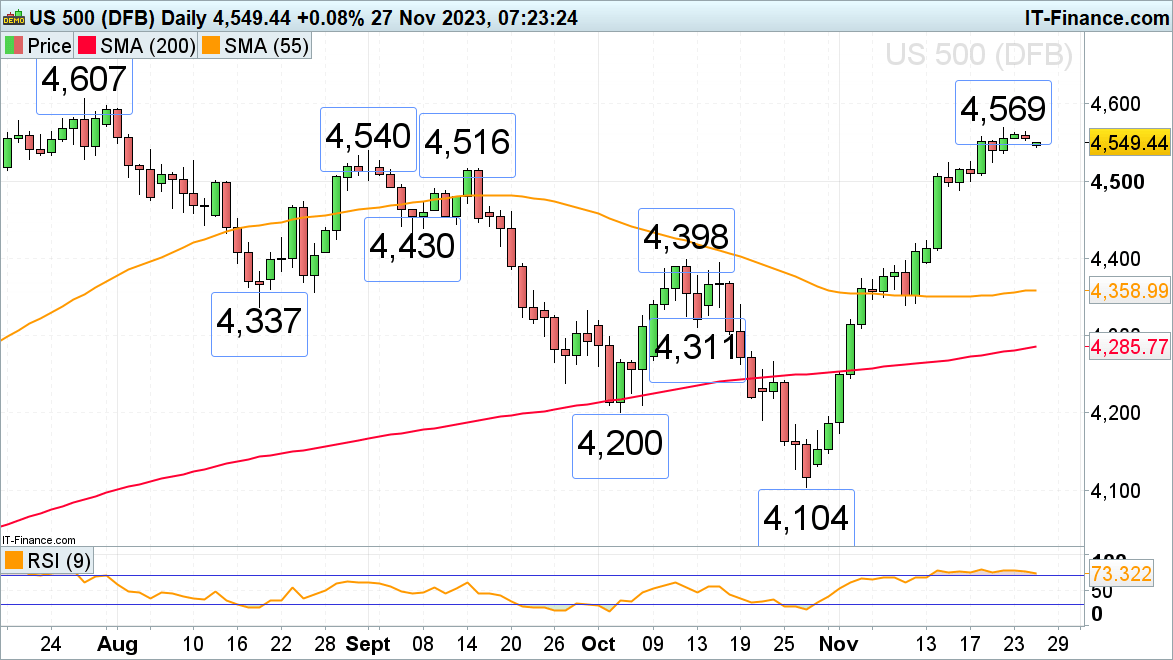
S&P 500 consolidates below its current 4,569 November peak
The sharp November rally in the S&P 500 has lost upside momentum amid the Thanksgiving holiday with little volume being traded, something which may continue on Cyber Monday as the economic calendar looks light with US new homes sales and the Dallas Fed manufacturing index.
Resistance is seen at the current November peak at 4,569 and immediate support at Wednesday’s 4,535 low. Further potential support can be spotted at the 4,524 mid-November high.
Only a currently unexpected rise above the recent 4,569 high could put the July peak at 4,607 on the cards.
S&P500 Daily Chart