Article by IG Senior Market Analyst Axel Rudolph
FTSE 100, DAX 40, Nasdaq 100 Analysis and Charts
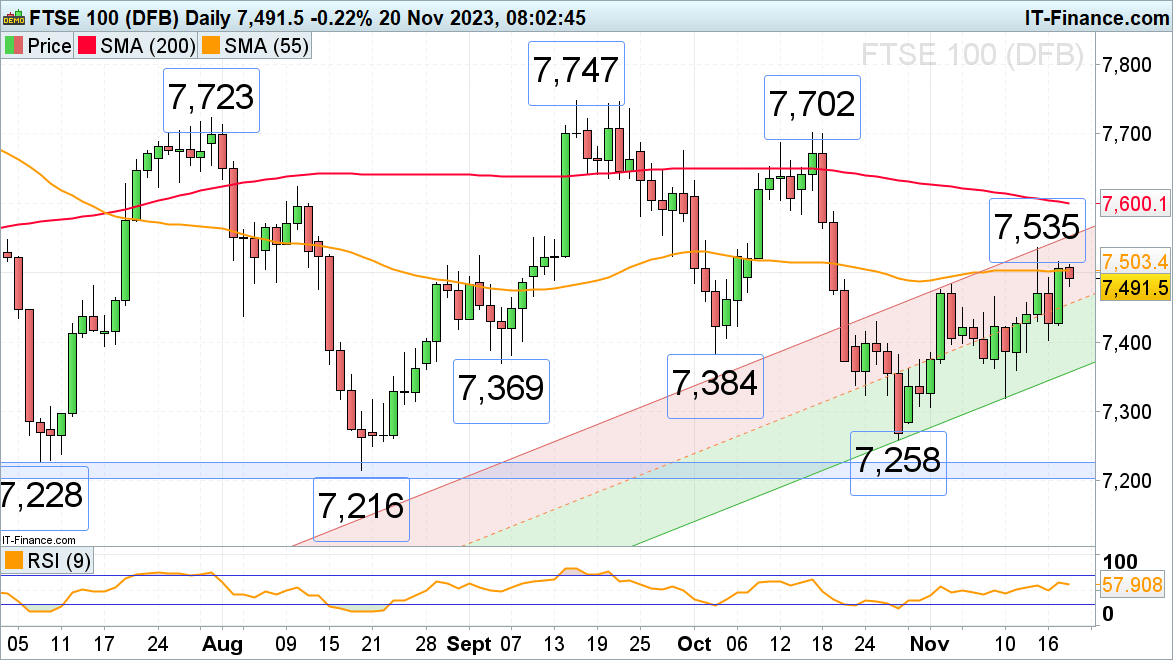
FTSE 100 nears last week’s high
Despite disappointing UK retail sales, which last week slid to their lowest level since the 2021 COVID-19 lockdown, the FTSE 100 remains on track to reach last week’s high at 7,535 amid an empty economic calendar on Monday.
The 55-day simple moving average (SMA) at 7,503 may act as short-term resistance on the way up but once it and the 7,535 peak have been exceeded, the 200-day simple moving average (SMA) at 7,600 will be in focus.
Minor support can be found around the 9 November high at 7,466. Further down lies Thursday’s 7,430 low, followed by the early September and early October lows at 7,384 to 7,369.
FTSE 100 Daily Chart
See How Changes in Client Sentiment can Affect Price Action
| Change in | Longs | Shorts | OI |
| Daily | 8% | -6% | -3% |
| Weekly | 6% | -1% | 0% |
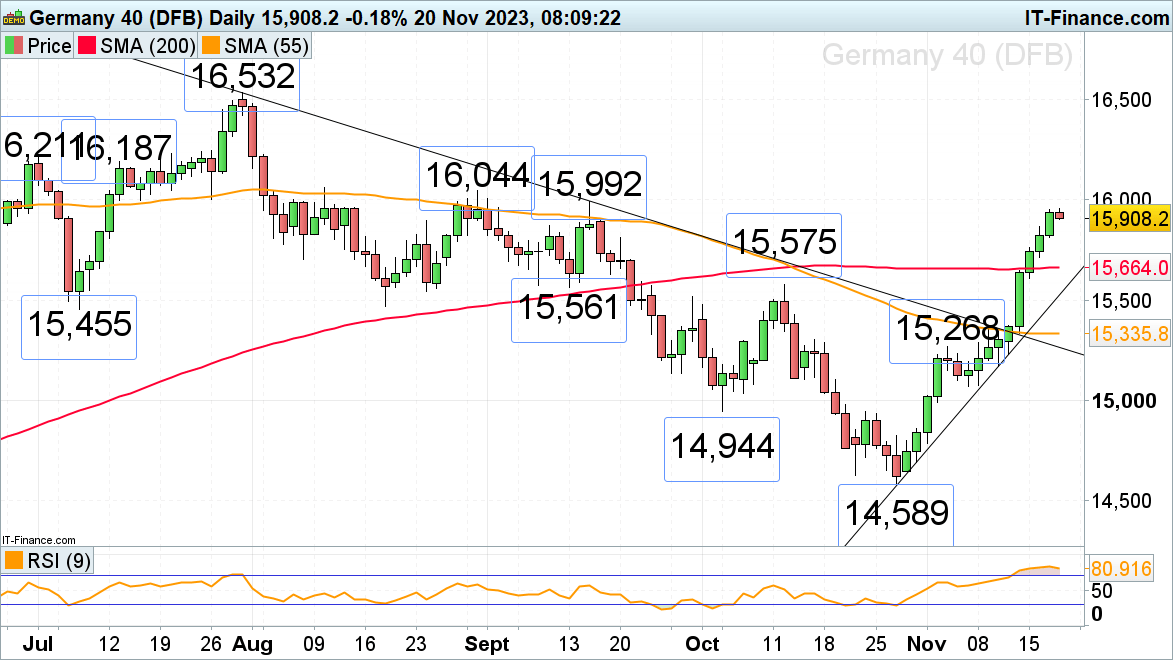
DAX 40 gunning for 16,000 mark
The DAX 40 continues to advance towards the psychological 16,000 mark as German October producer prices come in at -0.1% month-on-month as forecast.
The index has so far seen nine consecutive days of gains and is approaching the August and September highs at 15,992 to 16,044 which may short-term cap.
Minor support below Thursday’s high at 15,867 can be found at Thursday’s 15,710 low. Further down meanders the 200-day simple moving average at 15,664.
DAX40 Daily Chart

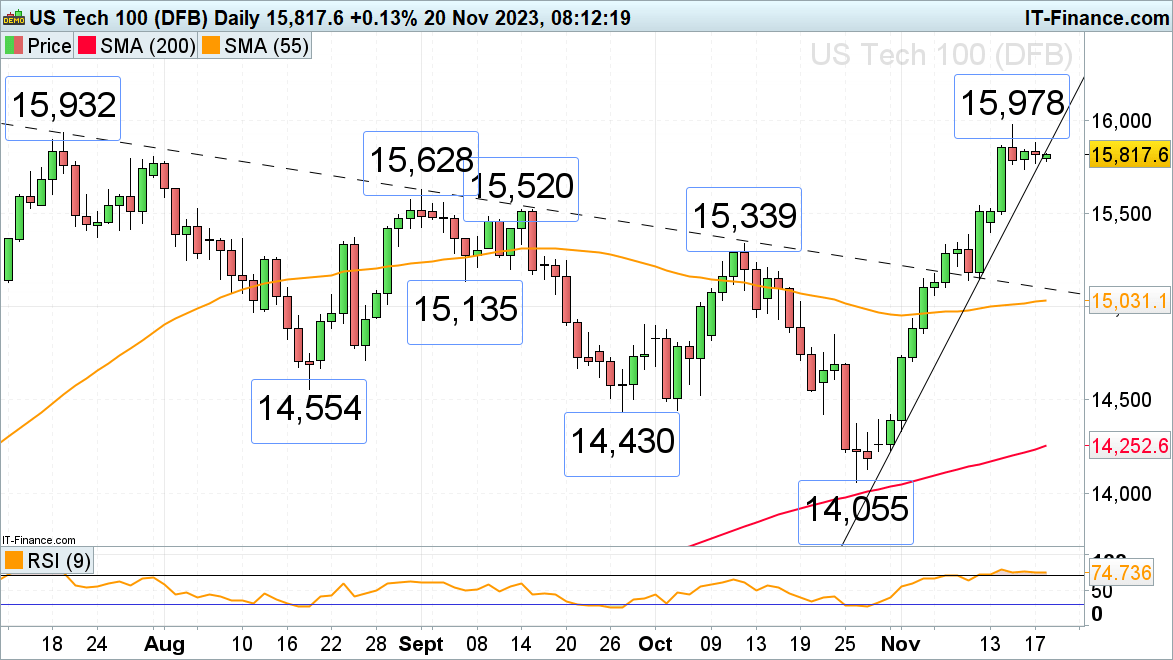
Nasdaq 100 consolidates below the 15,932 July peak
The Nasdaq 100’s 12% rally off its late October low has last week briefly taken the index to slightly above its July high at 15,932, to 15,978, before consolidating amid profit-taking ahead of this week’s Zoom and Nvidia earnings results. While the July and current November highs at 15,932 to 15,978 cap, Thursday’s low at 15,736 might be retested. Stronger support can be seen between the 15,628 to 15,520 early to mid-September highs.
A rise above 15,978 would put the December 2021 high at 16,660 into the frame.
Nasdaq 100 Daily Chart