


Article by IG Senior Market Analyst Axel Rudolph
FTSE 100, DAX 40, Nasdaq 100 Analysis and Charts
FTSE 100 falls out of bed as UK inflation unexpectedly rises
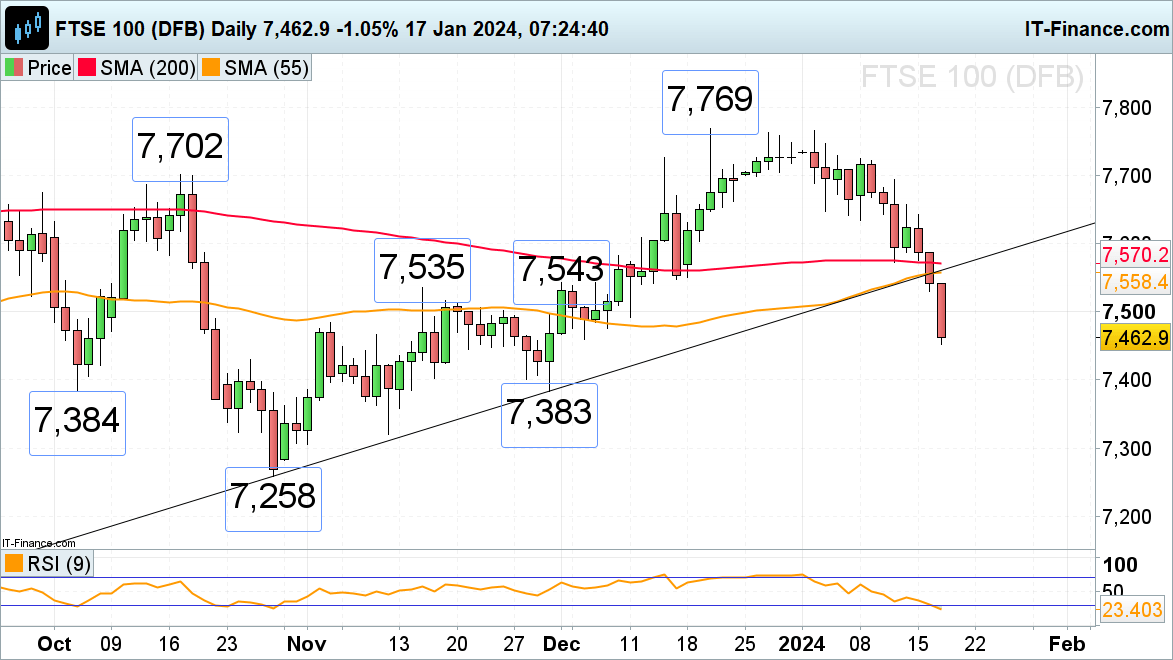
The FTSE 100, which on Tuesday slid through the 200-day simple moving average (SMA) at 7,570, opened much lower on Wednesday as UK inflation came in at a stronger-than-expected 4.0% in December and core inflation at 5.1%.
The 7,450 mark is in sight, below which the early October low and the late November low can be found at 7,384 to 7,383. Minor resistance sits at the 11 December low at 7,493 and can be seen around the minor psychological 7,500 mark.
FTSE 100 Daily Chart
Retail trader data shows 66.70% of traders are net-long with the ratio of traders long to short at 2.00 to 1 - What does this mean for FTSE 100 Traders?
| Change in | Longs | Shorts | OI |
| Daily | 7% | -5% | -3% |
| Weekly | 3% | 4% | 4% |
DAX 40 drops to six-week low
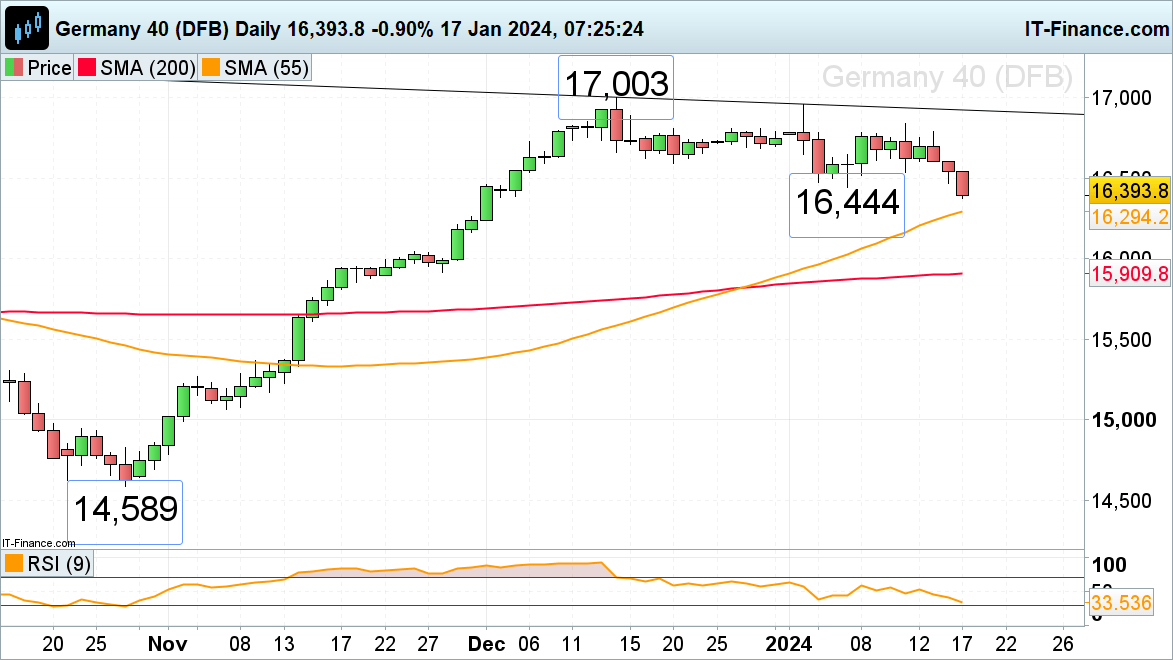
The DAX 40 index is on track for its third consecutive day of falls and is now trading at six-week lows amid hawkish central bank talk and as rate cut expectations are being pared back.
The 55-day simple moving average (SMA) at 16,294 represents the next downside target while the early January and Tuesday’s lows at 16,444 to 16,471 are expected to act as minor resistance. While no bullish reversal and rise above Thursday’s low at 16,535 is seen, the medium-term trend continues to point down.
DAX 40 Daily Chart

Nasdaq 100 expected to open lower
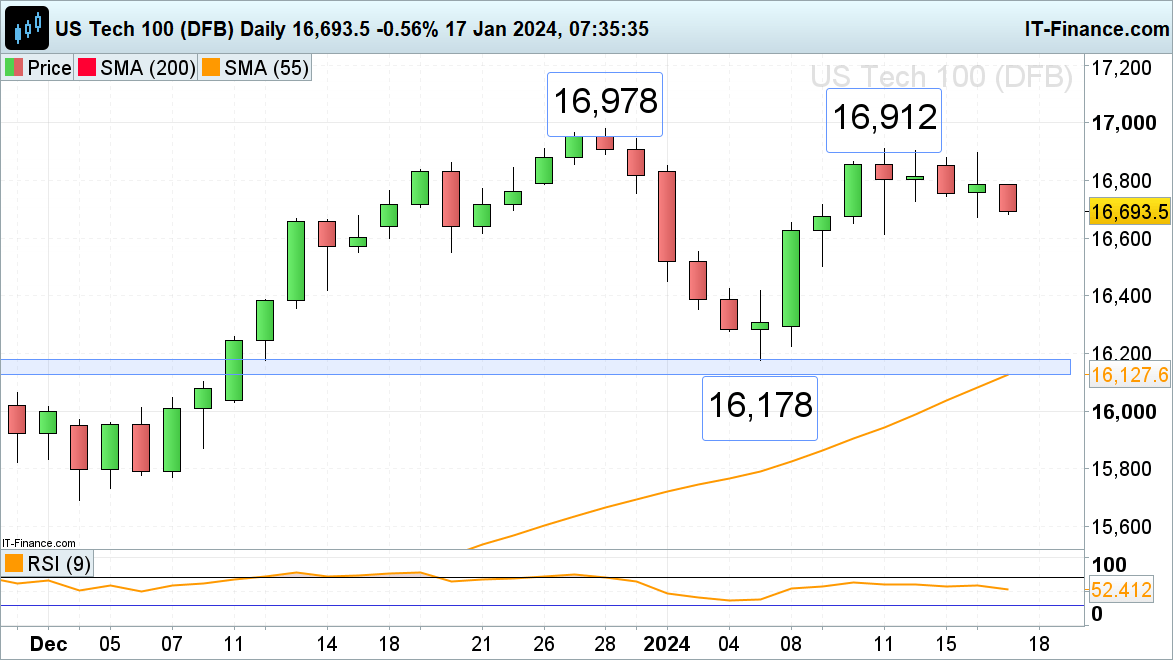
The Nasdaq 100 remains under pressure amid mixed US earnings and a speech by US Federal Reserve (Fed) governor Waller in which he advocated moving ‘carefully’ with rate cuts and mentioned reducing quantitative tightening but didn’t give a timeline.
Tuesday’s low at 16,674 may be revisited, a slip-through which would engage the 11 January low at 16,614 and perhaps also the 20 December low at 16,552.
In case of a rebound, minor resistance between Friday and Monday’s lows at 16,726 to 16,743 may stall the index. If not, last and this week’s highs at 16,897 to 16,912 might remain in play.
Nasdaq 100 Daily Chart
Learn how to build confidence in trading with our complimentary guide.


