Article by IG Senior Market Analyst Axel Rudolph
FTSE 100, DAX 40, Nasdaq 100 Analysis and Charts
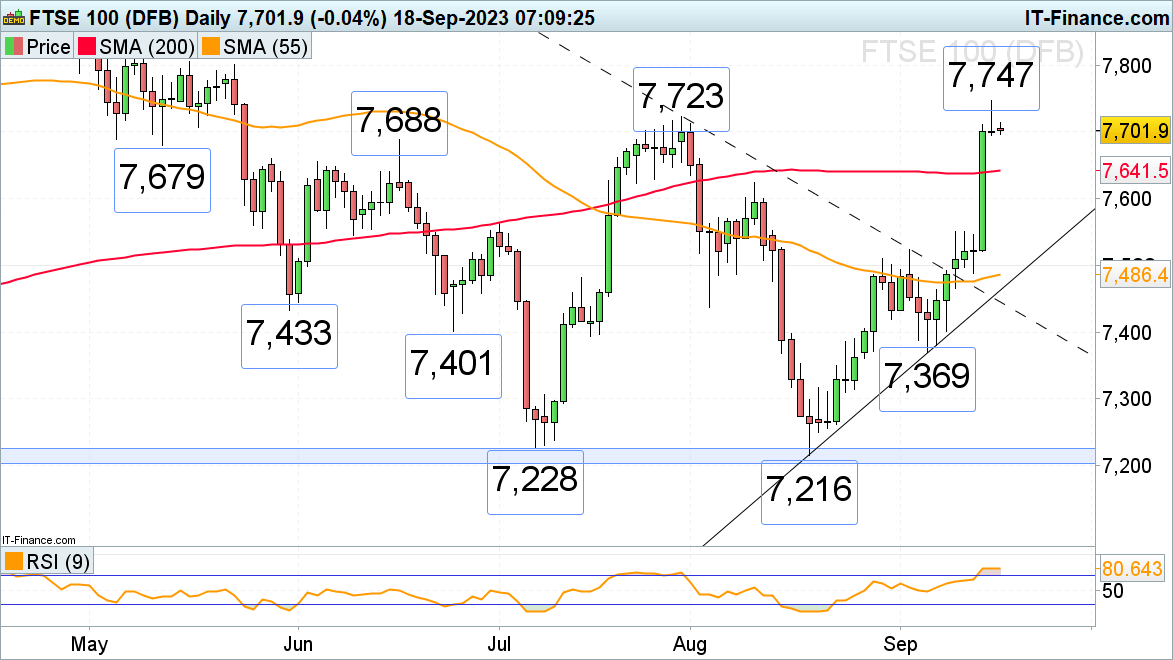
FTSE 100 consolidates below its 3 ½ month high
Last week the FTSE 100 had its best week in nine months as it rose by over 3%, buoyed by the rising oil price and mining stocks after China cut its reserve requirements for the second time in 2023. The UK blue chip index is expected to at least short-term consolidate below its 3 ½ month high at 7,747 as UK rental prices surge to multi-year highs while house prices stagnate and as traders await Thursday’s Bank of England (BoE) rate decision.
A slip back to the 7,688 to 7,679 mid-May low and mid-June high thus looks probable with the 200-day simple moving average (SMA) at 7,642 possibly being reached as well.Minor resistance can be spotted around the 7,723 July peak and at last week’s 7,747 high. If bettered, the psychological 7,800 mark and the 7,817 8 May high could be in focus.
FTSE 100 Daily Chart

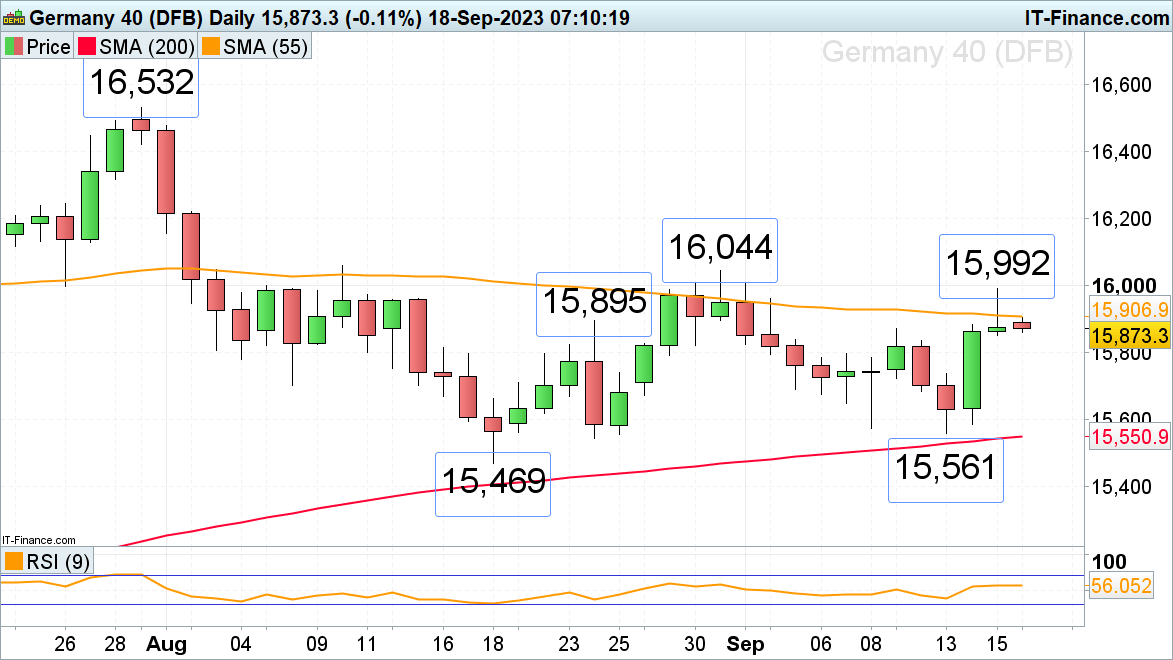
DAX 40 continues to range trade
The DAX 40 rallied last week as the European Central Bank (ECB) raised its deposit rate to 4% whilst announcing that it wasn’t planning any more rate hikes as it was lowering its Eurozone growth forecasts for the years to come.The German stock index rose above its 55-day simple moving average (SMA) at 15,907 and reached a high at 15,992 on Friday before slipping back towards its open. The moving average acts as a resistance line on Monday morning.
Minor support below the 55-day SMA at 15,907 can be found at last Monday’s 15,871 high ahead of the 7 September high at 15,797. Further minor support sits at the 15,739 high seen last Wednesday. Only a rise above last week’s high at 15,992 would engage the August peak at 16,044. It needs to be overcome for a medium-term bottoming formation to be confirmed. In this case, a rise back toward the July high at 16,532 may unfold until year-end.
DAX 40 Daily Chart
Download the Free DAX Sentiment Survey
| Change in | Longs | Shorts | OI |
| Daily | 3% | -2% | -1% |
| Weekly | 17% | -9% | -4% |
Nasdaq 100 is seen topping out
The Nasdaq 100 dropped by 1.75% on Friday, bringing the index back down towards its previous week’s low at 15,135 as US consumer sentiment fell more than expected and US import prices rose the most in over a year, re-igniting inflationary fears.
Were the 15,135 low to be slipped through, the March-to-September uptrend line at 15,125 may act as support. If not, a drop back towards the late June and August lows at 14,689 to 14,554 might ensue. Resistance comes in along the 55-day simple moving average (SMA) at 15,312 and at Thursday’s 15,332 low.
For a bullish reversal to be seen, a rise and daily chart close above last week’s high at 15,520 would need to occur. Slightly above it lies the early September high at 15,628.
Nasdaq 100 Daily Chart