


RAND TALKING POINTS & ANALYSIS
- SARB likely to pause.
- US retail sales data keeps rand on the front foot.
- 200-day MA under the spotlight.
Trade Smarter - Sign up for the DailyFX Newsletter
Receive timely and compelling market commentary from the DailyFX team
USD/ZAR FUNDAMENTAL BACKDROP
After a volatile week last week, the rand has been pushed back by underwhelming Chinese manufacturing PMI (see economic calendar below) that has filtered across global markets with the largest impact of commodity linked currencies like the ZAR. Being a close trading partner with China, the negative reaction on the Emerging Market (EM) currency has been exacerbated trading roughly 0.85% lower against the US dollar.
Foundational Trading Knowledge
Macro Fundamentals
Recommended by Warren Venketas
South African private sector credit naturally fell reflecting the tight monetary policy adopted by the South African Reserve Bank (SARB) over the measured period. Balance of trade numbers for June printed below expectations thus reducing the demand for ZAR over the period, and with no other high impact data scheduled for today, it will be interesting to see how markets react once the US trading session opens.
USD/ZAR ECONOMIC CALENDAR (GMT +02:00)
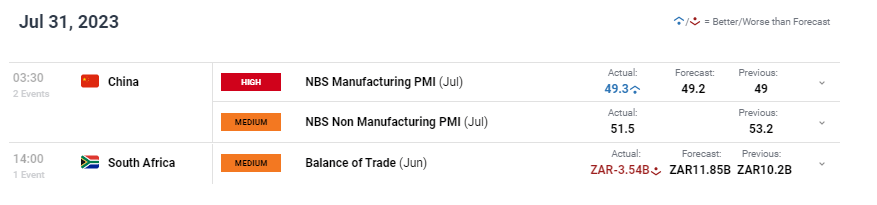
Source: DailyFX Economic Calendar
The week ahead will be largely driven by dollar based factors including US ISM services PMI (highly significant considering the US is primarily services driven) and the Non-Farm Payroll (NFP) reports respectively. Markets will be monitoring these data points as a continuation of the recent core PCE release that has provided a dovish tone with respect to the Federal Reserve and their interest rate hiking cycle. The US labor market in particular has been exceedingly robust and any signs of change may weigh negatively on the USD.
TECHNICAL ANALYSIS
USD/ZAR DAILY CHART
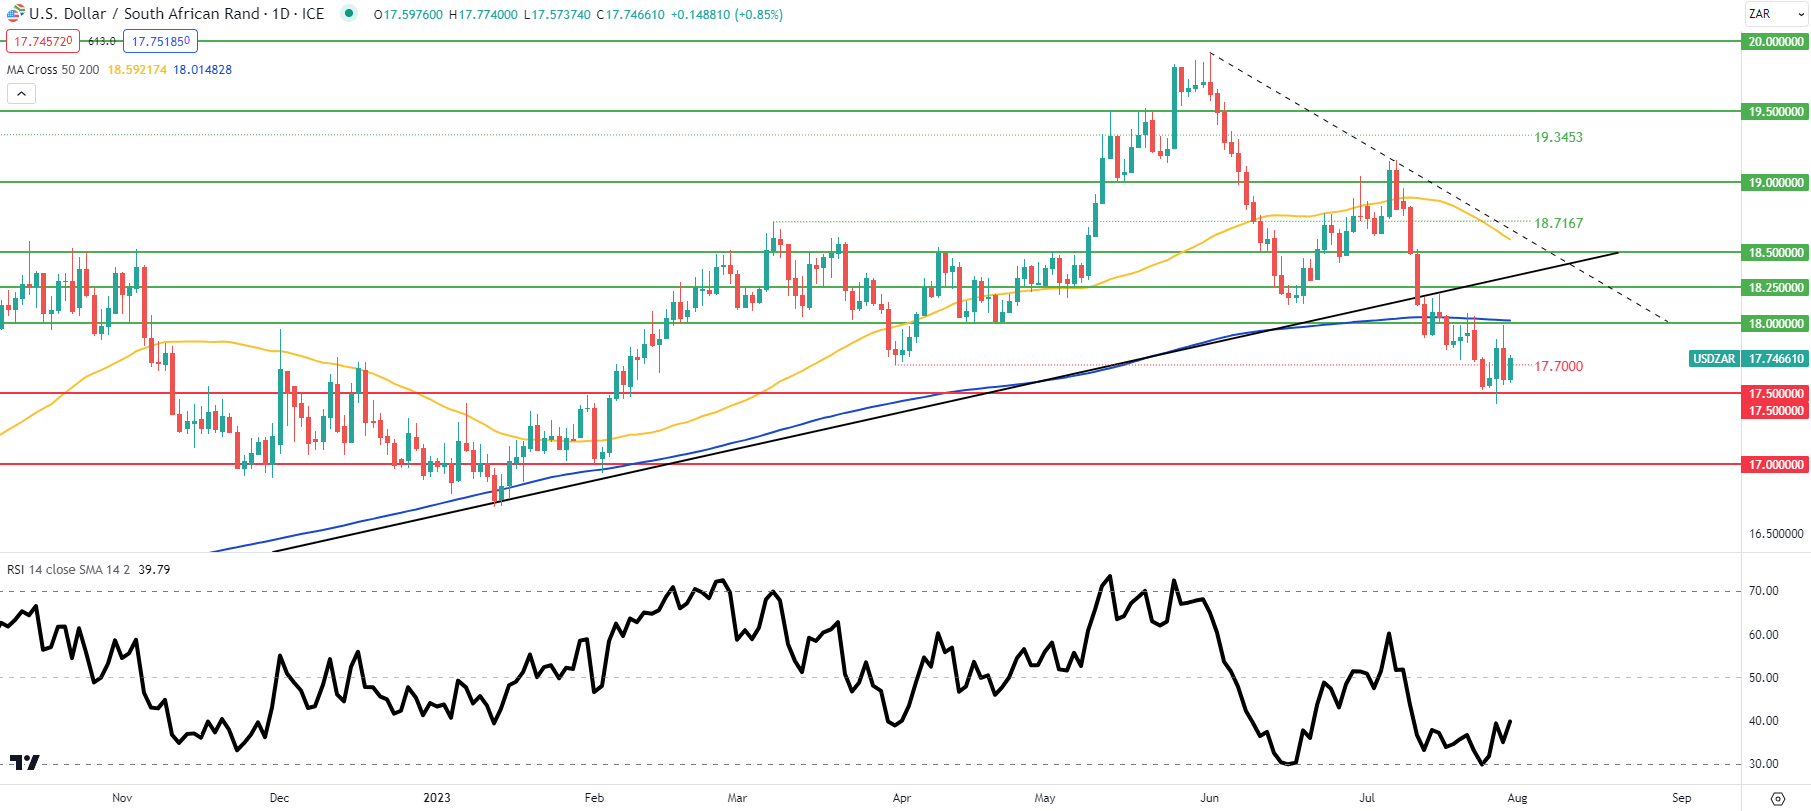
Chart prepared by Warren Venketas, IG
Daily USD/ZAR price action remains glued to the 17.7000 swing support handle as the pair attempts to push higher out of the oversold region of the Relative Strength Index (RSI). For now it is clear traders are relatively cautious ahead of key US economic data and will likely be fundamentally driven throughout the week.
Resistance levels:
- 18.2500
- 18.0000/200-day moving average (blue)
Support levels:
- 17.7000
- 17.5000
Contact and followWarrenon Twitter:@WVenketas


