


US DOLLAR FORECAST:
USD FORECAST: NEUTRAL
- US PCE Data Slows More than Expected Adding to the ‘Soft-Landing’ Narrative.
- ISM Manufacturing Data May Give a Clearer Picture Around Whether the US Economy is Slowing on the Demand Side.
- Dollar Index (DXY) Hits a Two-Week High Before a Pullback from the Confluence Area Around the 102.00 Handle.
- To Learn More About Price Action,Chart PatternsandMoving Averages, Check out theDailyFX Education Series.

READ MORE: USD/ZAR Shrugs Off Resurgent Dollar, Eyes Break of 17.50 Support
US DOLLAR INDEX AND US YIELDS POST FOMC
The US Dollar has enjoyed a mixed week to say the least but remains on course for a weekly gain. Friday’s data out of the US was a mixed bag as well with a slight miss for the Michigan Consumer Sentiment print but Core PCE data showed promising signs slowing faster than expected.
READ MORE: Fed’s Favorite Inflation Gauge Slows More than Expected in June, US Dollar Subdued
The Core PCE data of course is the most telling given that it is the Feds preferred inflation gauge. A drop of 0.5% from the May print has only further added to hopes that the Fed are likely done with regard to current hiking cycle. This coupled with labor cost rising at their slowest pace in 2 years could explain some of the weakness in US Dollar on Friday.
If we look at the effects on US Yields this week and similar to the DXY it’s been a mixed bag to say the least. Friday saw a bit of a pullback after a rally in yields on Thursday to 2-week highs with the US2Y reaching a high of 4.93%, the July 10 high. Yield curve inversion remains at an extreme level despite a slight narrowing on Friday to around 86bps. A sign of things to come or am I being overly optimistic at this stage?
US 2Y and US 10Y Yields
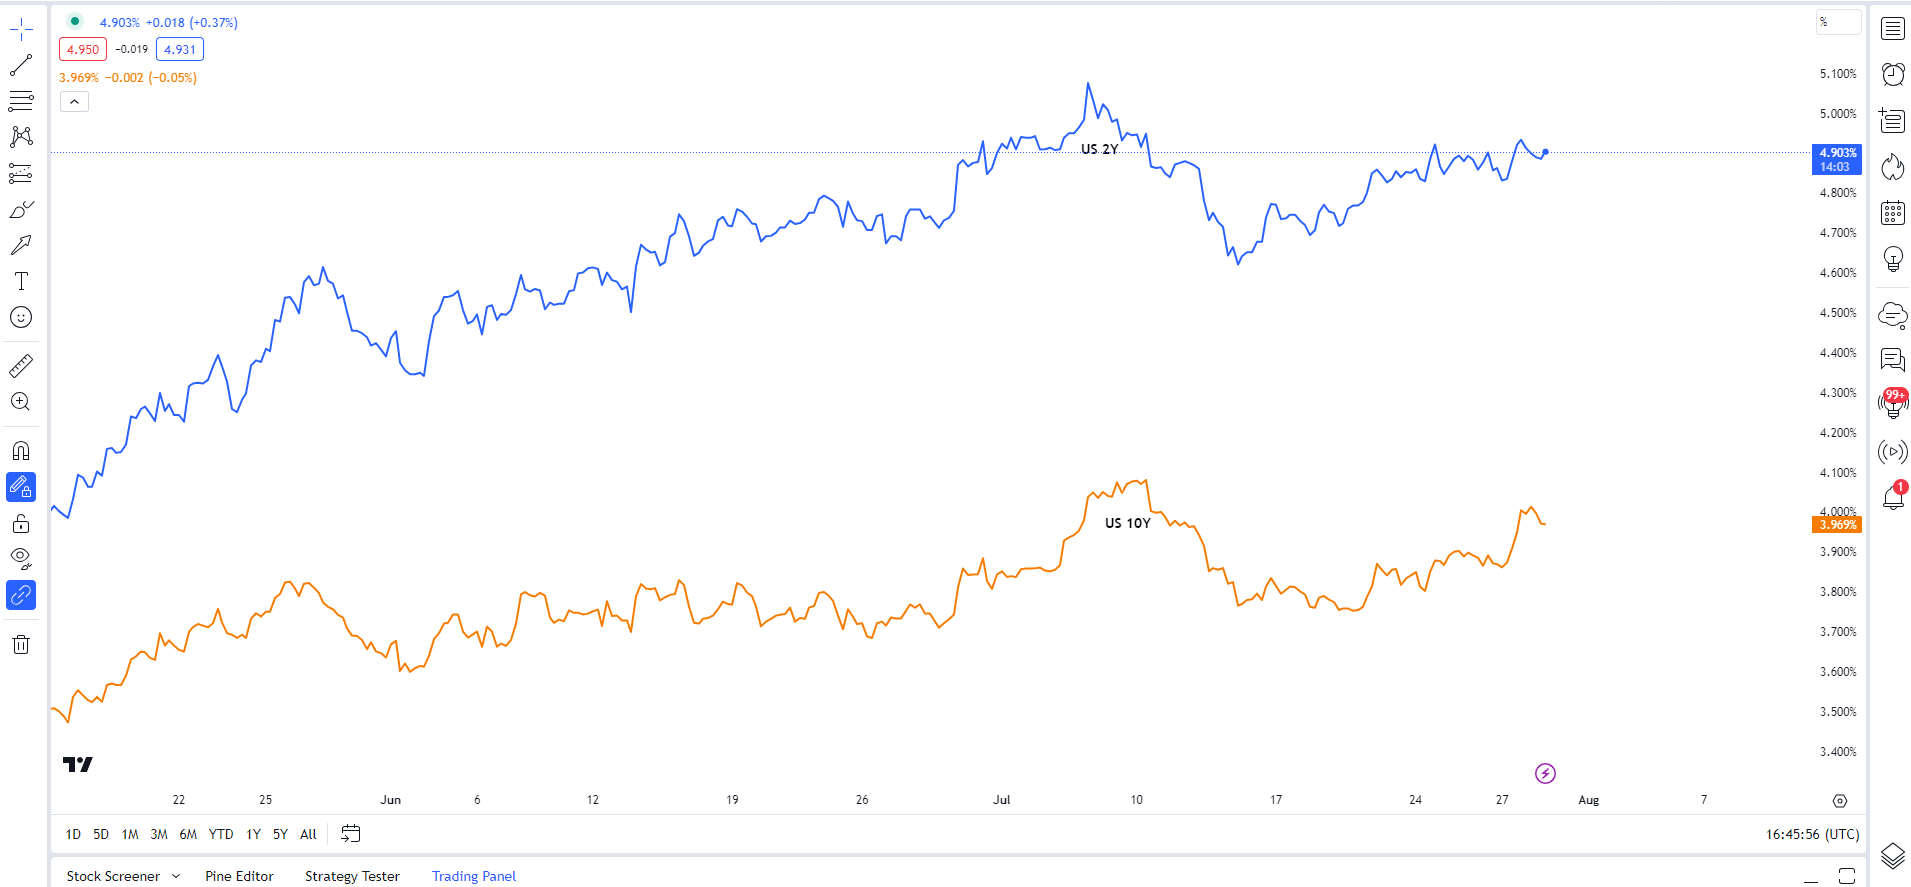
Source: TradingView, Created by Zain Vawda
THE WEEK AHEAD: NFP JOBS AND ISM DATA
Heading into next week and the DXY is delicately poised heading into the second month of Q3. The ongoing narrative for a soft landing could end up hurting the US Dollar moving forward if US equities continue to rise. The longer this narrative continues the more intriguing Q3 is expected to be at least in my humble opinion. This week will bring updated jobs and NFP data which will give us another snapshot at the health of the US economy. Average hourly earnings will once more be a key gauge for the Fed as strong wage growth has been touted as a problem in the ongoing inflation tussle.
ISM data is also expected in the week ahead with services as always likely to hold a bigger sway given the US economy is primarily service driven. However, I do think the ISM manufacturing data may hold more sway in the week ahead after the recent PMI data not just in the US but globally showed significant signs of a slowdown. With that in mind a significant miss to the downside could rekindle some recessionary fears even if it may be short-lived. This has been a theme of 2023 thus far with constant shifting of sentiment as during high impact data and risk events.
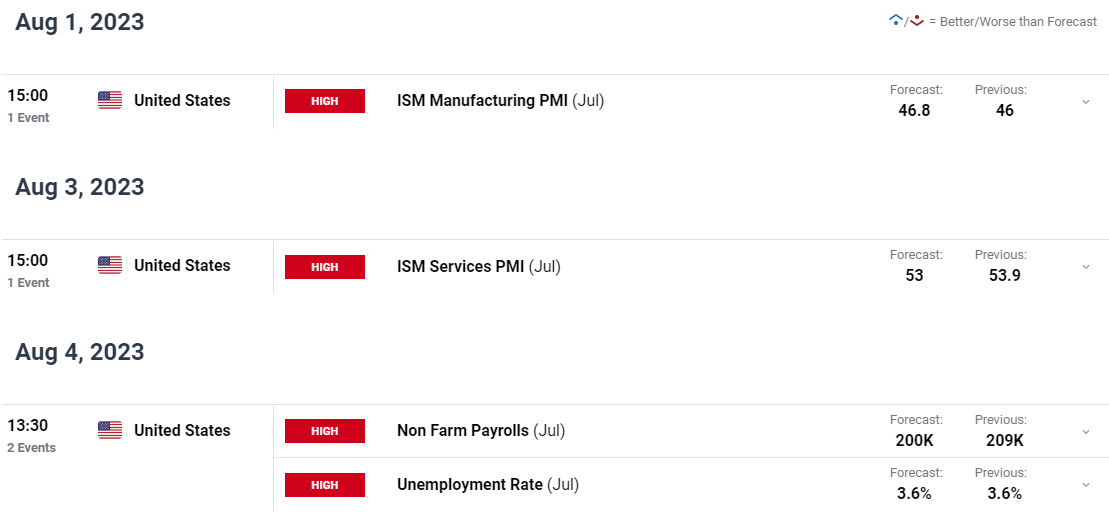
For all market-moving economic releases and events, see the DailyFX Calendar
Trade Smarter - Sign up for the DailyFX Newsletter
Receive timely and compelling market commentary from the DailyFX team
TECHNICAL OUTLOOK AND FINAL THOUGHTS
The Dollar Index has enjoyed further upside this week running into a key confluence area around the 102.00 handle which lines up with the 61.8% fib retracement level. Friday’s daily candle is on course to close as a doji candle following a significant upside rally which in theory hints at further downside in the week ahead. The possibility of a death cross also lingers as the 50-day MA eyes a cross below the 100-day MA and might be worth monitoring heading into next week.
US Dollar Index (DXY) Daily Chart – July 28, 2023
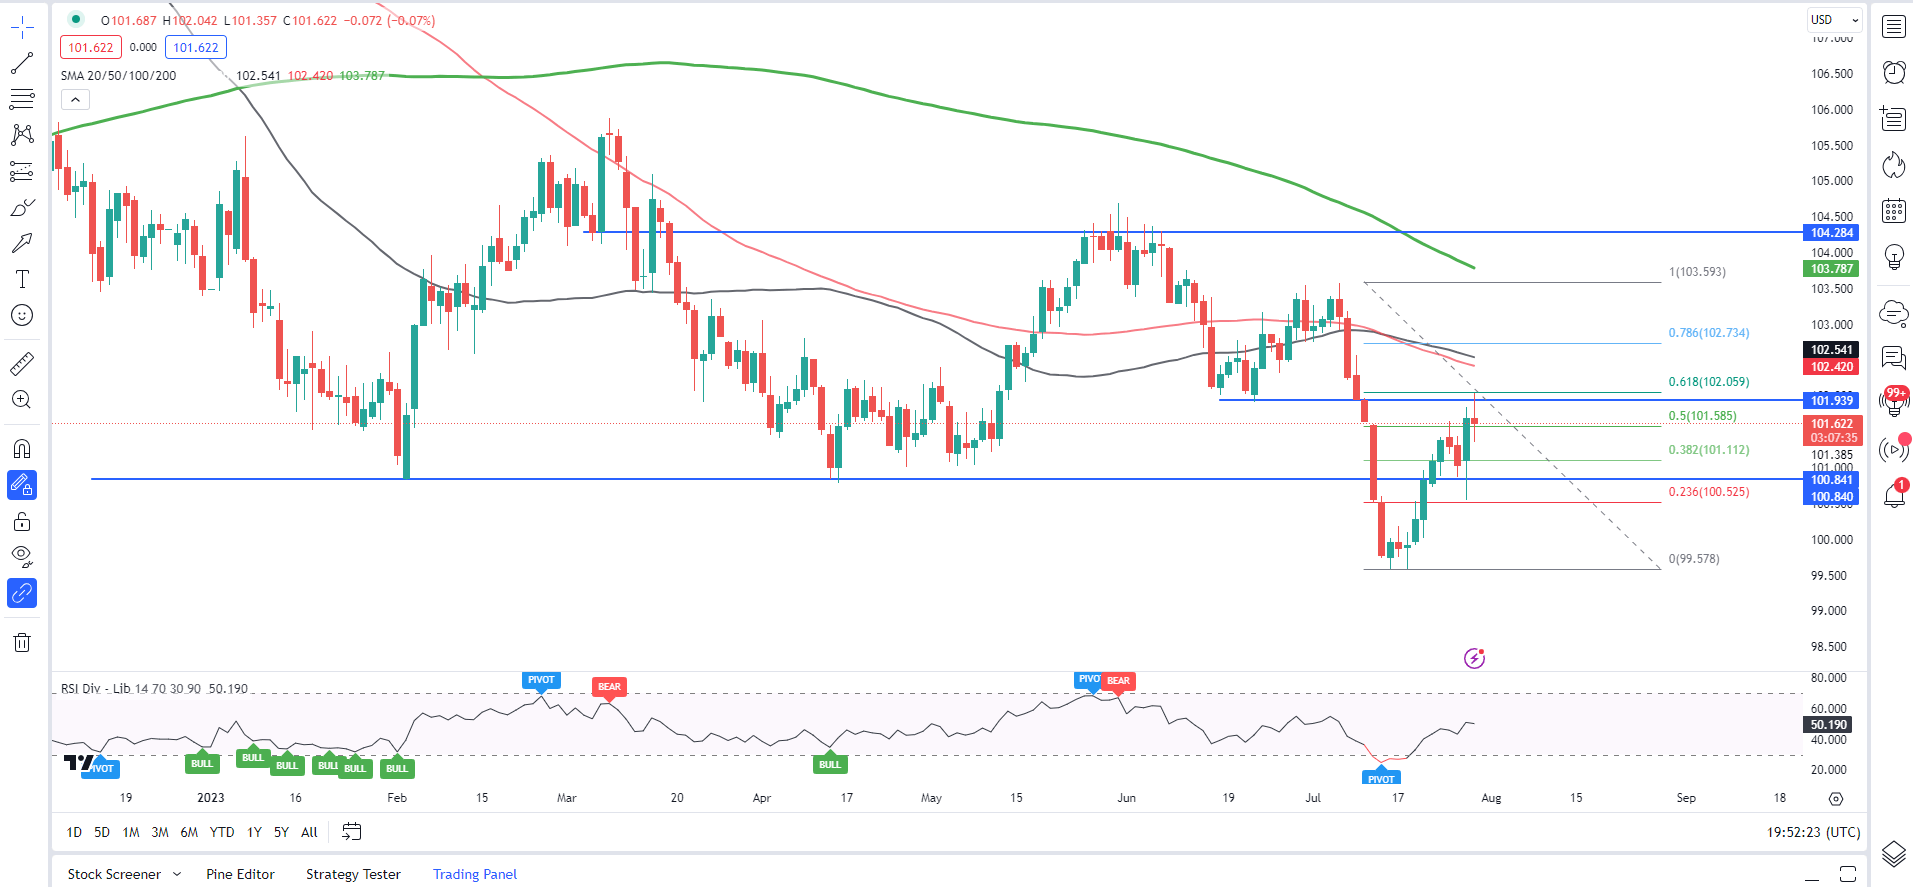
Source: TradingView
Looking at the weekly timeframe and a doji candle close appears to be on the cards as well backing up the narrative from the daily timeframe as well. We are trading in a channel at the moment and a cannot rule out a push higher toward the top end of the channel, however the DXY will first need to clear the 100-day MA and the 102.00 confluence area.
US Dollar Index (DXY) Weekly Chart – July 28, 2023
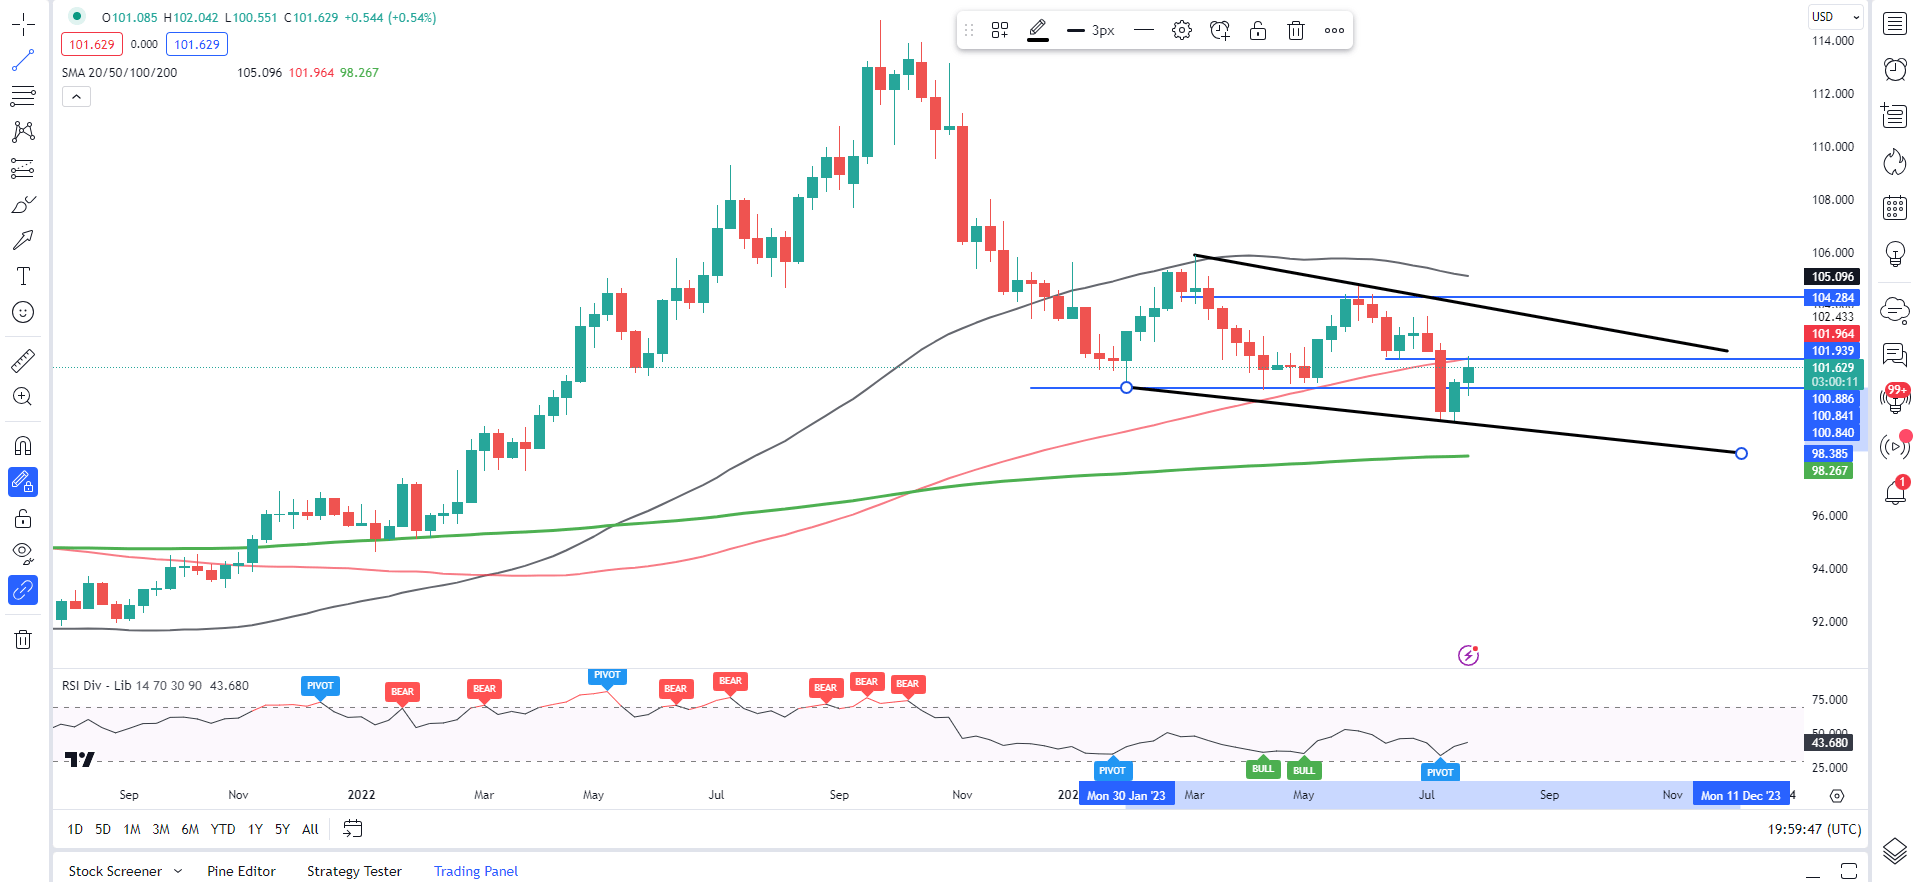
Source: TradingView
Alternatively, a push to the downside from current prices faces a challenge at the 100.84 handle before eyeing a test of the psychological 100.00 level. A lot to keep an eye on heading into next week with constant changes in sentiment likely to continue and drive price action.
Written by: Zain Vawda, Market Writer for DailyFX.com
Contact and follow Zain on Twitter: @zvawda


