


US DOLLAR OUTLOOK:
- The U.S. dollar index breaks below major Fibonacci support amid falling bond rates
- Treasury yields sink as weaker-than-expected economic data prompt traders to discount a more dovish monetary policy outlook
- In the current environment, the DXY index is likely to remain biased to the downside

Most Read: US Dollar Q2 Technical Forecast - Sellers Take Hold of Steering Wheel
The U.S. dollar, as measured by the DXY index, dropped moderately on Tuesday, breaking below the psychological 102.00 handle and reaching its weakest level since early February, dragged lower by falling U.S. Treasury yields following worse-than-expected U.S. economic data.
Earlier in the session, an employment report (JOLTS) showed that job openings stood at 9.931 million in February, well below expectations for a reading of 10.50 million and the lowest print since May 2021, a sign that hiring freezes are starting to spread quickly amid growing headwinds.
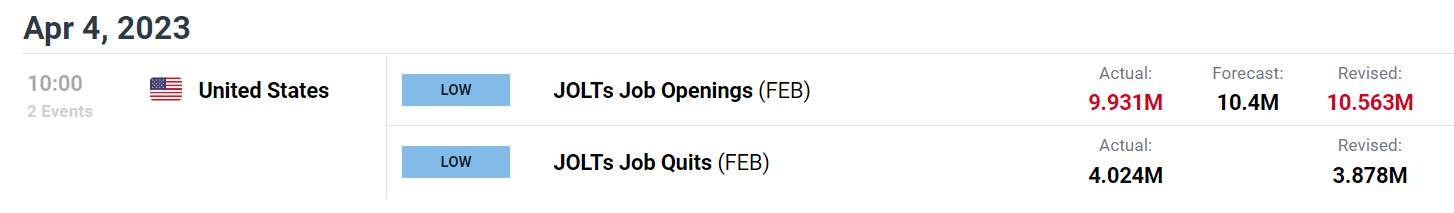
Source: DailyFX Economic Calendar
Although the Federal Reserve has indicated time and again that it has no intention of cutting interest rates this year, the weakening labor market could lead policymakers to reassess the strategy, especially if job losses begin to outpace payroll growth and lead to a higher unemployment rate.
Looking at Fed funds futures, traders appear to be positioning for an imminent pivot in monetary policy, with year-end rates seen at 4.41%. This implies about 50 bps of easing from the central bank’s current stance.

2023 FED FUNDS FUTURES
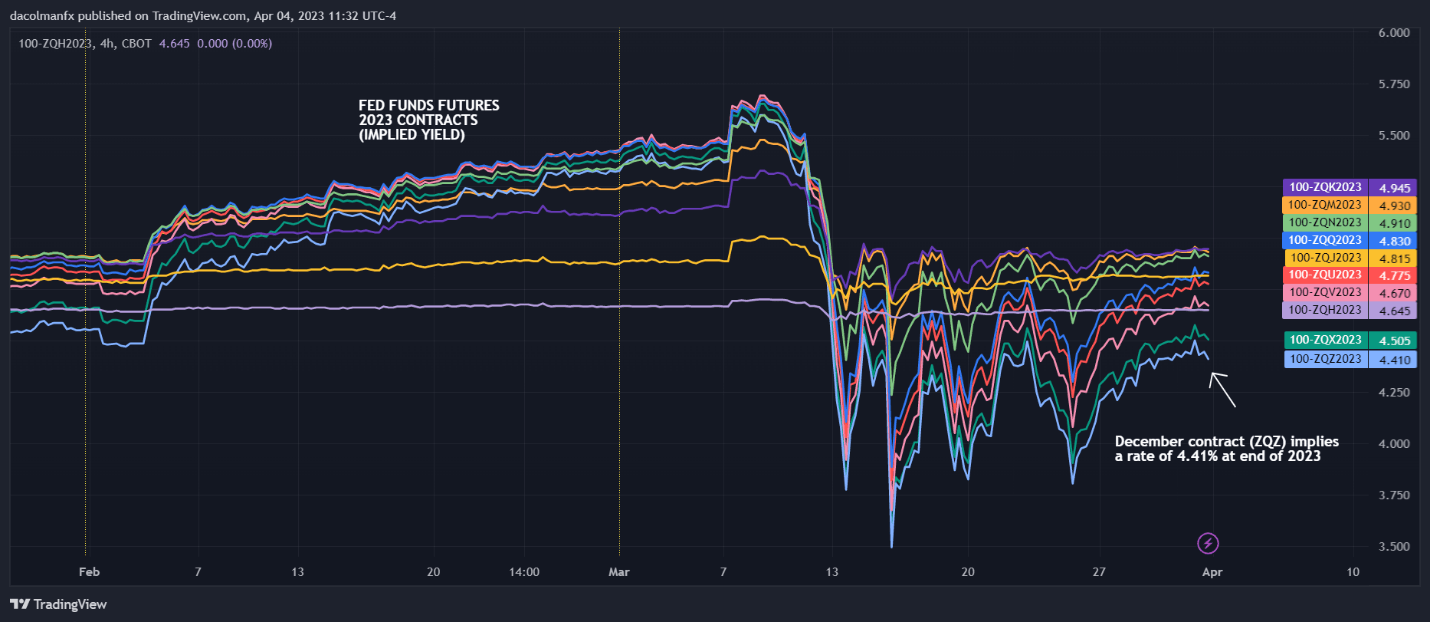
Source: TradingView
The monetary policy outlook could shift in a more dovish direction if incoming data continues to disappoint in the near term. This scenario should not be ruled out as the recent U.S. banking sector turmoil will lead to tighter credit conditions over the coming months, curtailing economic activity and suppressing inflation.
In the current environment, the broad direction of travel is likely to be lower for the U.S. dollar, provided market sentiment does not worsen materially, as that could boost haven demand and bolster defensive assets.
In terms of technical analysis, the DXY index has breached key support at 102.02, which corresponds to the 50% Fibonacci retracement of the January 2021/September 2022 advance. If this breakdown is sustained, sellers could launch an attack on February’s low at 100.82. On further weakness, the focus shifts to 99.00, the 68.2% Fib retracement of the 2021/2022 move discussed before.
On the flip side, if buyers regain control of the market, initial resistance rests at 102.02, followed by 103.40.

US DOLLAR (DXY) TECHNICAL CHART
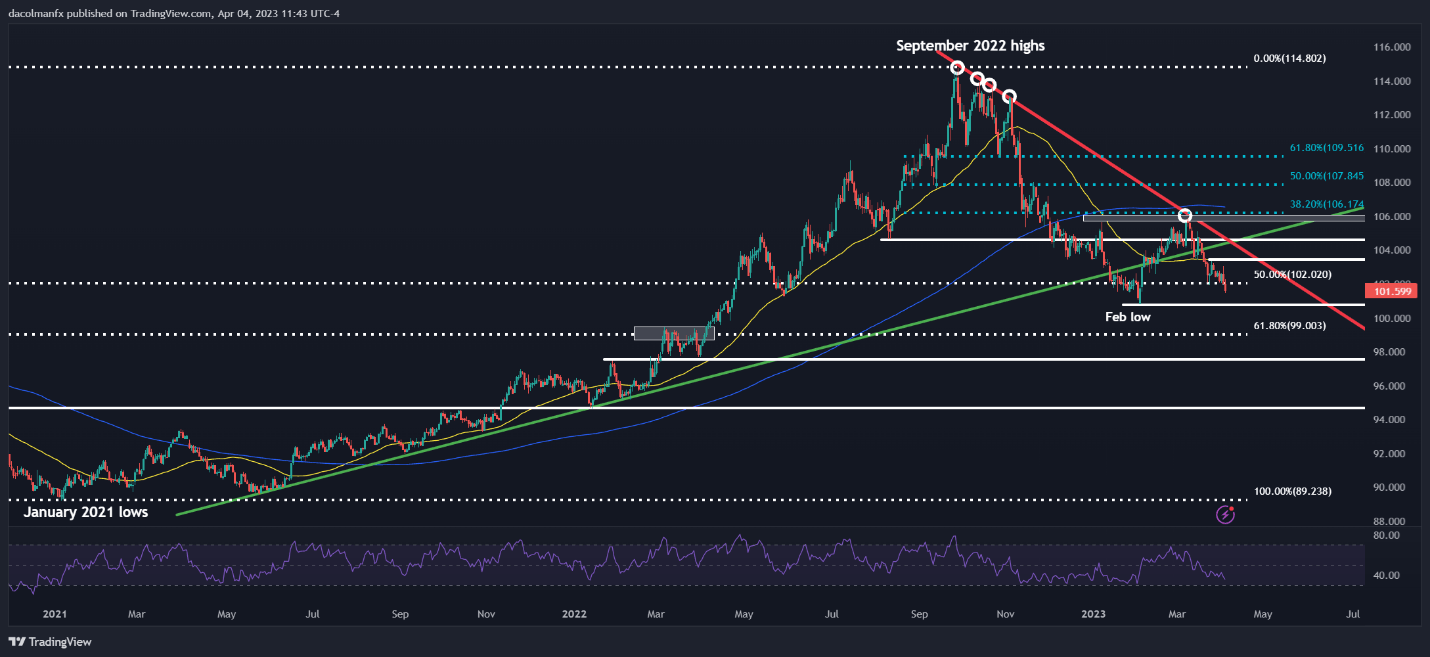
US Dollar Index (DXY) Technical Chart Prepared Using TradingView


