Trade Smarter - Sign up for the DailyFX Newsletter
Receive timely and compelling market commentary from the DailyFX team
EUR/USD ANALYSIS
EUR/USD has been falling on a sustained basis since mid-July more or less. This downward trend has been primarily driven by the contrasting economic performance of the United States and the Euro Area, alongside disparities in the monetary policies pursued by their respective central banks, with this divergence pushing U.S. Treasury yields to multi-year highs across maturities in recent days.
Presently, the Federal Reserve's benchmark rate stands at an impressive 5.25%-5.50%, well ahead of the European Central Bank’s deposit facility rate of 4.0%. This gap could widen further in the coming months, as U.S. borrowing costs could rise by another 25 basis points in 2023, while those across the Atlantic could remain unchanged, with the ECB having signaled that the tightening campaign is over.
Although investors harbor doubts that the Fed will hike again this year, the market's assessment could change if U.S. macro data stays hot. For this reason, traders should closely watch next week's U.S. personal consumption expenditure figures for August. Any indication that the U.S. consumer continues to spend strongly and that price pressures remain sticky should be bullish for the U.S. dollar.
Hone the skills that lead to trading consistency. Grab your copy of the "How to Trade EUR/USD" guide, featuring priceless insights and tips from our team of experts!

KEY US ECONOMIC DATA NEXT WEEK
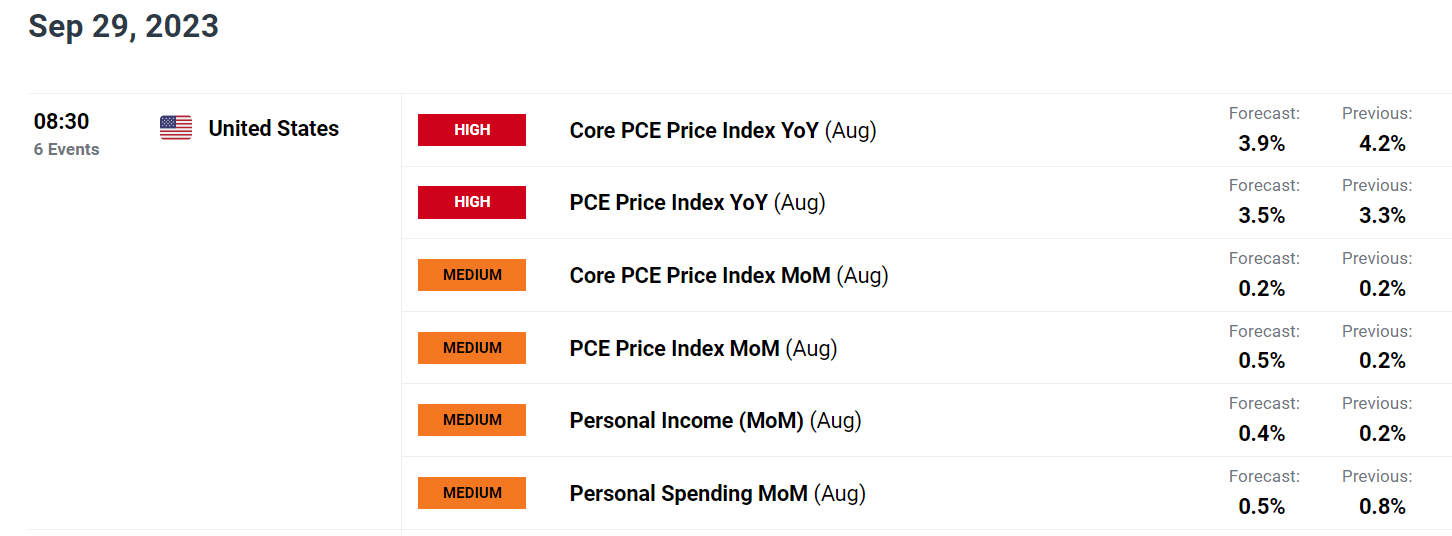
Source: DailyFX Economic Calendar
From a technical analysis perspective, EUR/USD has anchored itself to a support region surrounding a key Fibonacci level at 1.0610 after its recent retracement. Although this zone may offer robust protection against further losses, a breach could unleash substantial downward pressure, paving the way for a descent towards 1.0570, followed by 1.0500.
On the flip side, if buyers unexpectedly reassert their dominance in the market and spark a bullish turnaround, initial resistance can be spotted in the 1.0760/1.0785 range, as shown in the accompanying chart below. Upside clearance of this barrier could boost upward momentum, setting the stage for a rally toward the 200-day SMA at 1.0830. On further strength, the focus shifts to 1.1025.
Discover the power of crowd sentiment. Download the sentiment guide to understand how EUR/USD's positioning can influence the pair's direction!
| Change in | Longs | Shorts | OI |
| Daily | -15% | 14% | -4% |
| Weekly | -14% | 3% | -7% |
EUR/USD TECHNICAL CHART
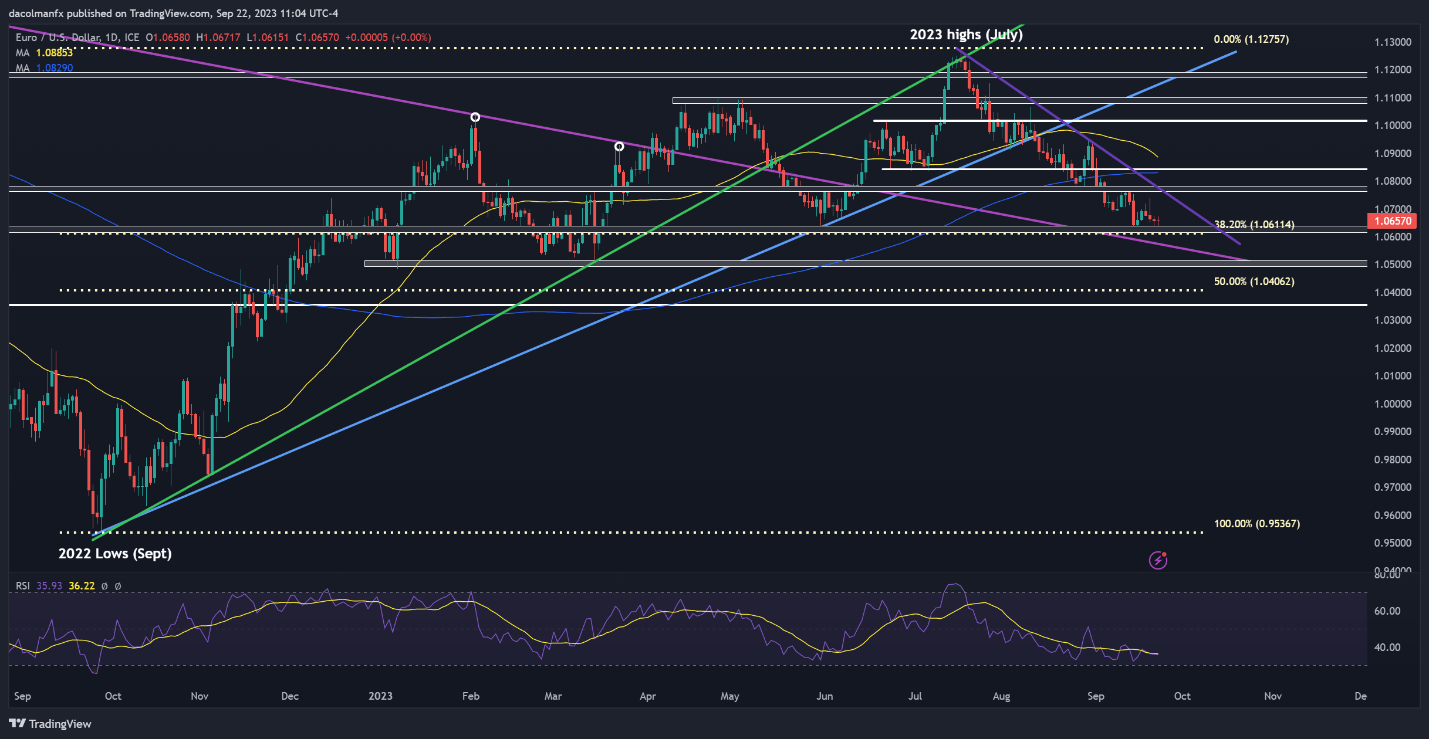
EUR/USD Chart Prepared Using TradingView
Wondering why trading can be so challenging? Uncover the traits that set successful traders apart from the rest! Grab the guide below to find out!

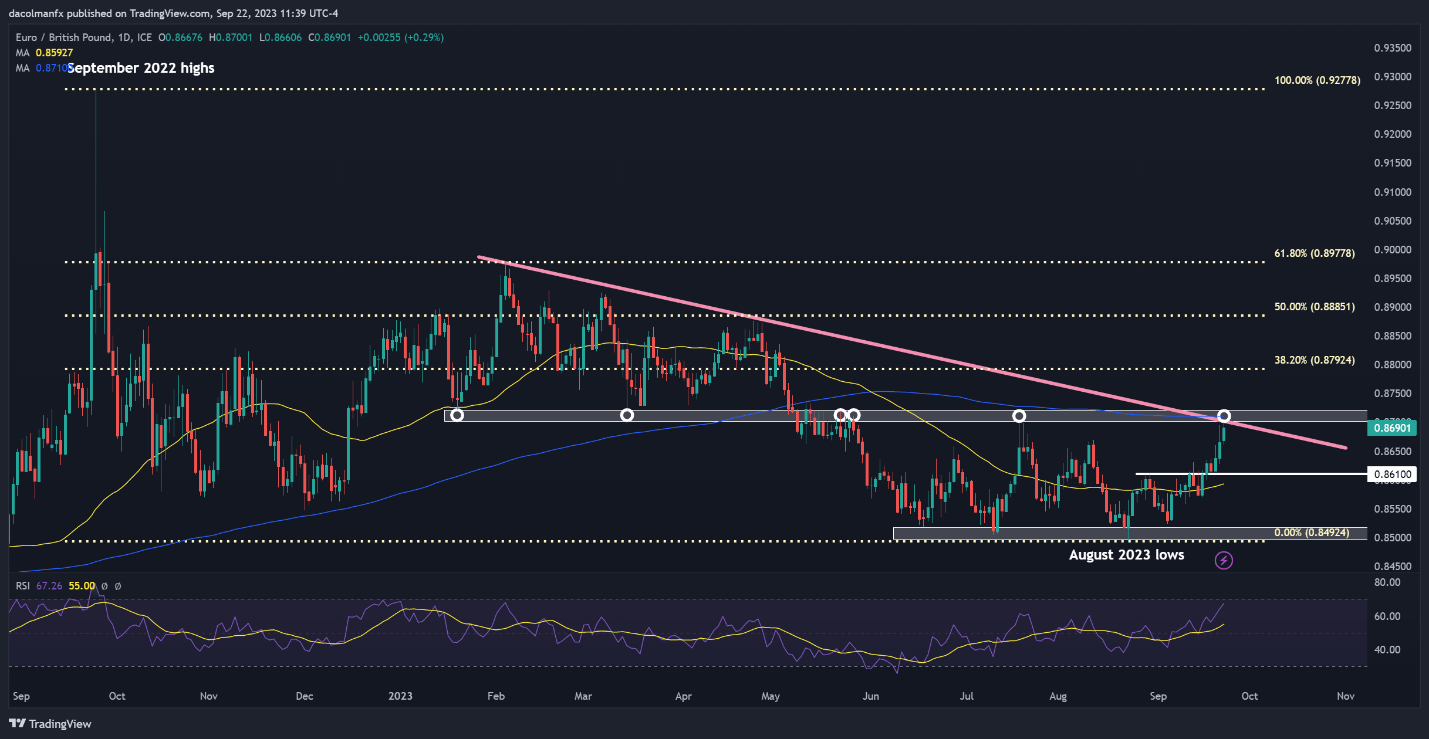
EUR/GBP ANALYSIS
EUR/GBP has been trekking upwards since early September, as shown on the daily chart below, but over a longer time horizon, the pair has lacked strong directional conviction, trading largely sideways, trapped within the confines of an impeccable lateral channel (no man’s land so to speak) - a sign of indecision given the weak fundamentals of both currencies.
Ranging markets can be predictable and easy to trade at times, but the whole premise is to establish a short position in the underlying when its price moves toward resistance in anticipation of a pullback or to go long at technical support ahead of a possible rebound.
Looking at EUR/GBP, prices are currently approaching the upper limit of the horizontal corridor at 0.8700, which also coincides with trendline resistance and the 200-day SMA. A substantial number of sellers may be clustered in this area, so a pullback is likely on a retest, though a breakout could open the door to a move towards 0.8792, the 38.2% Fib retracement of the Sept 2022/Aug 2023 slump.
In case of a bearish rejection, we could see a drop towards 0.8610. On further weakness, the focus shifts to 0.8520, a region near the 2023 lows.
EUR/GBP TECHNICAL CHART