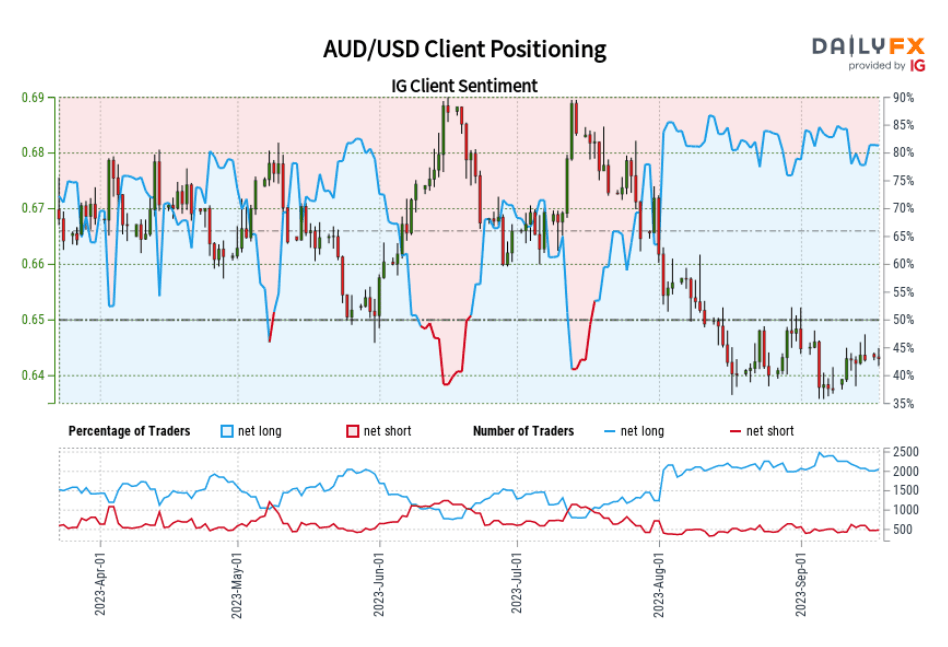
AUD/USD MARKET SENTIMENT ANALYSIS
According to IG's proprietary data, a substantial 79.55% of AUD/USD traders currently hold long positions, resulting in a bullish-to-bearish ratio of 3.89 to 1 as of late afternoon on Monday.
The tally of clients who are net long has risen by 2.75% since yesterday and by 3.44% over the previous week. Conversely, the number of net-short traders has climbed by 13.46% compared to the previous session, but has decreased by 20% over the preceding week.
Our approach often involves adopting a contrarian stance when evaluating crowd sentiment, and the current scenario where traders are predominantly net-long implies that there may be room for weakness in AUD/USD. This insight underscores the possibility that sentiment has leaned excessively in one direction, potentially leading to a pullback in the exchange rate.
Stay ahead of AUD/USD trends. Download the sentiment guide to understand how positioning can offer clues about near-term market moves.
| Change in | Longs | Shorts | OI |
| Daily | 0% | 0% | 0% |
| Weekly | 26% | -3% | 11% |
Enhance your trading prowess and seize opportunities in the currency market. Get the “How to Trade AUD/USD” guide for insight and ideas!

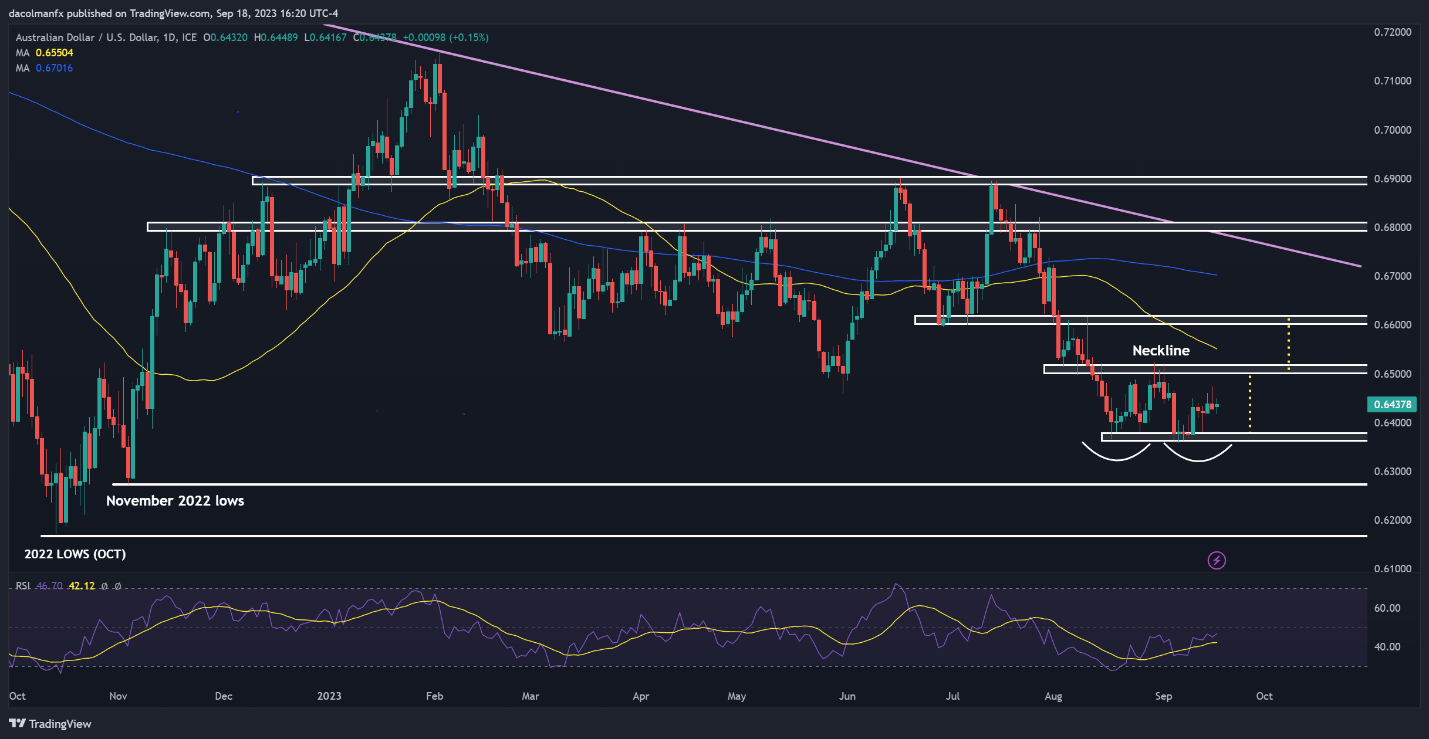
AUD/USD TECHNICAL ANALYSIS
Price action and technical pattern assessment present a distinct perspective for AUD/USD when contrasted with sentiment analysis, so caution is warranted in the days ahead. That said, the pair appears to be carving out a double bottom, which normally tends to presage the exhaustion of selling pressure ahead of a sustained recovery.
A double bottom is a reversal pattern, characterized by two comparable troughs separated by a peak, typically observed within a prolonged downtrend. Confirmation of this bullish configuration takes place when the asset in question completes the distinctive "W" shape and breaches resistance at the neckline, marked by the intermediate peak.
Turning our attention to the daily chart below, neckline resistance appears positioned at the range of 0.6500 to 0.6510. Should the pair break above this barrier successfully, we could see a rally toward the 0.6600 handle in short order.
On the flip side, if market momentum shifts in favor of sellers and prices take a tumble, initial support is identifiable at 0.6360. While AUD/USD may establish a base around these levels during a pullback, a breakdown could trigger a steep retracement, setting the stage for a drop toward 0.6275, in which case, the double bottom would be invalidated.
Level up your trading skills: gain a deeper understanding of the Australian dollar outlook with insights from both fundamentals and technical analysis. Access your quarterly guide today!

AUD/USD TECHNICAL CHART