Article by IG Chief Market Analyst Chris Beauchamp
Dow Jones, Nikkei 225, CAC40 Prices, Charts, and Analysis
Foundational Trading Knowledge
Trading Discipline
Recommended by IG
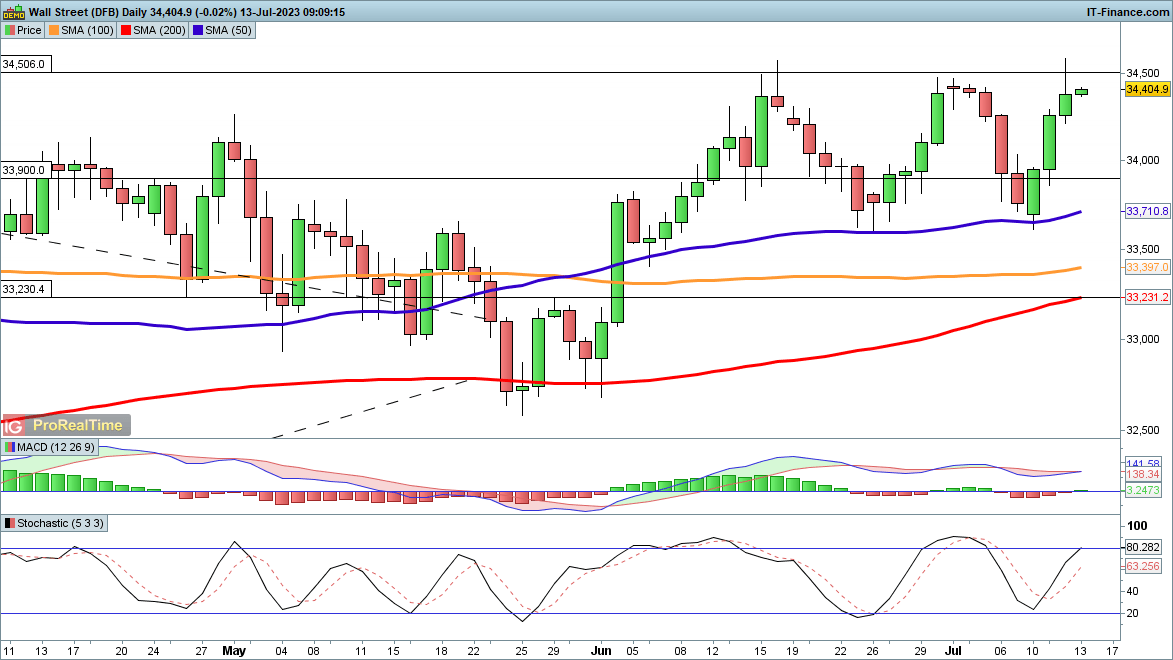
Dow looks to break 34,500
The index rallied in the wake of the CPI reading, but was unable to hold on to gains above 34,500. This leaves the range of recent weeks intact, but with risk appetite once again building following the inflation print we could see a close above 34,500. This would mark a bullish development and open the way to 35,000 and the December highs.
A reversal below 33,600 would be needed to put the sellers back in charge.
Dow Jones Daily Chart

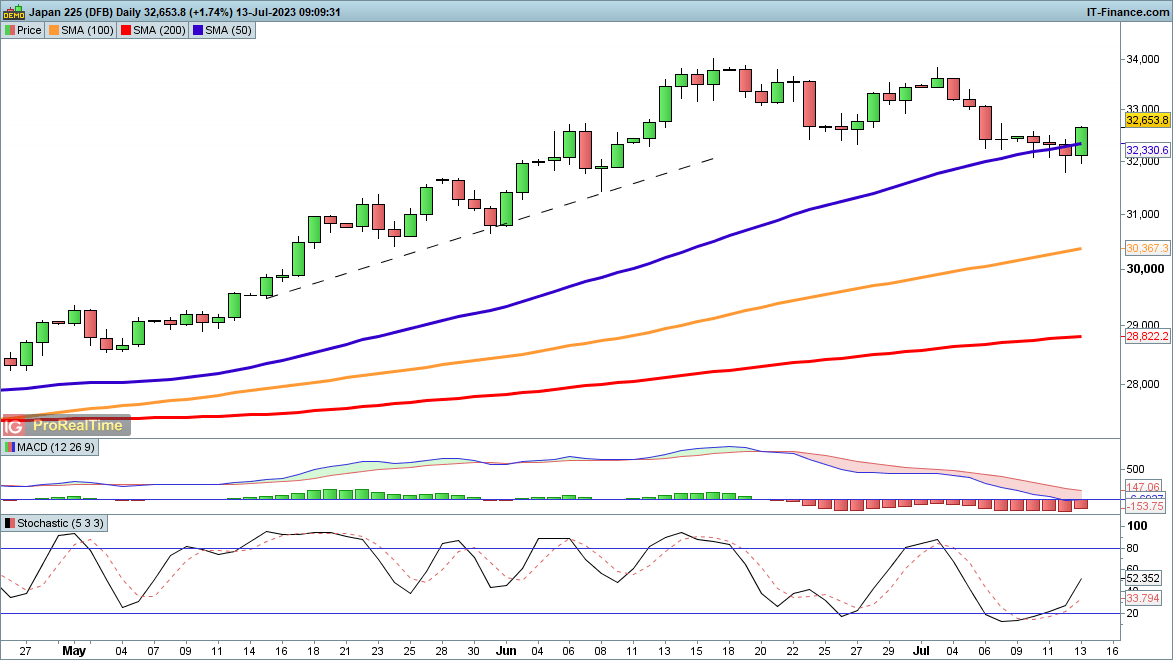
Nikkei 225 stablises after losses
The pullback continues, with the price finally dropping below the 50-day SMA and closing below it on Wednesday. From here the 31,460 level may be the next area of possible support. The overall uptrend is still arguably intact, though as yet a higher low has yet to form.
A recovery above 32,500 would help to bolster the bullish view and potentially open the way to 34,000 again.
Nikkei 225 Daily Chart
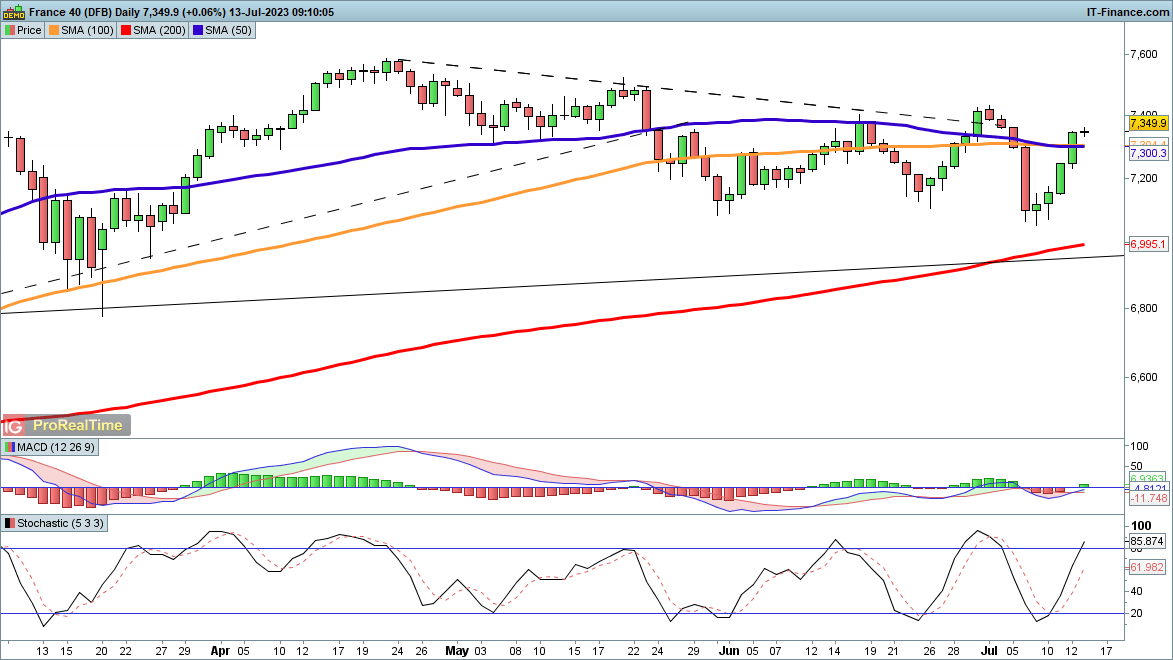
CAC40 continues to gain
A fourth day of gains has seen the index move back above the 50-day and 100-day SMAs. A low has been formed and now the price needs to push on above 7400 to suggest that a more bullish view prevails. This would then bring 7500 and 7590 into view as upside targets.
A reversal back below 7200 would be needed to indicate that the sellers are regaining control, which could then see the price test last week’s lows around 7080, and then the 200-day SMA.
CAC40 Daily Chart