


Article by IG Senior Market Analyst Axel Rudolph
FTSE 100, DAX 40, Nasdaq 100 - Analysis and Charts
FTSE 100 continues to be side-lined
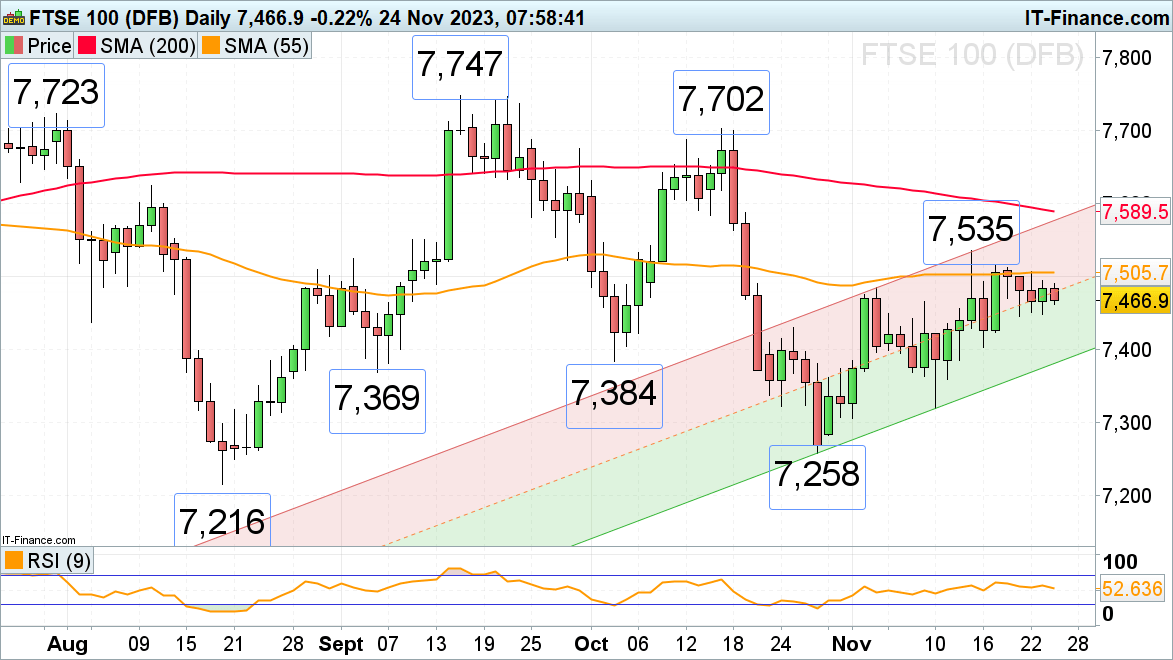
The FTSE 100 continues to be range bound below the 55-day simple moving average (SMA) at 7,505. Despite UK consumer confidence rising in November a negative bias has been seen since the start of the day.
While the UK blue chip index stays above Tuesday’s 7,446 low, it remains within a gradual uptrend, targeting last Friday’s 7,516 high. If overcome, the current November peak at 7,535 will be eyed ahead of the 200-day simple moving average (SMA) at 7,589.
Below Tuesday’s 7,446 low minor support can be seen around last Thursday’s low at 7,430, and the early September and early October lows at 7,384 to 7,369.
FTSE 100 Daily Chart

DAX 40 continues to flirt with the 16,000 mark
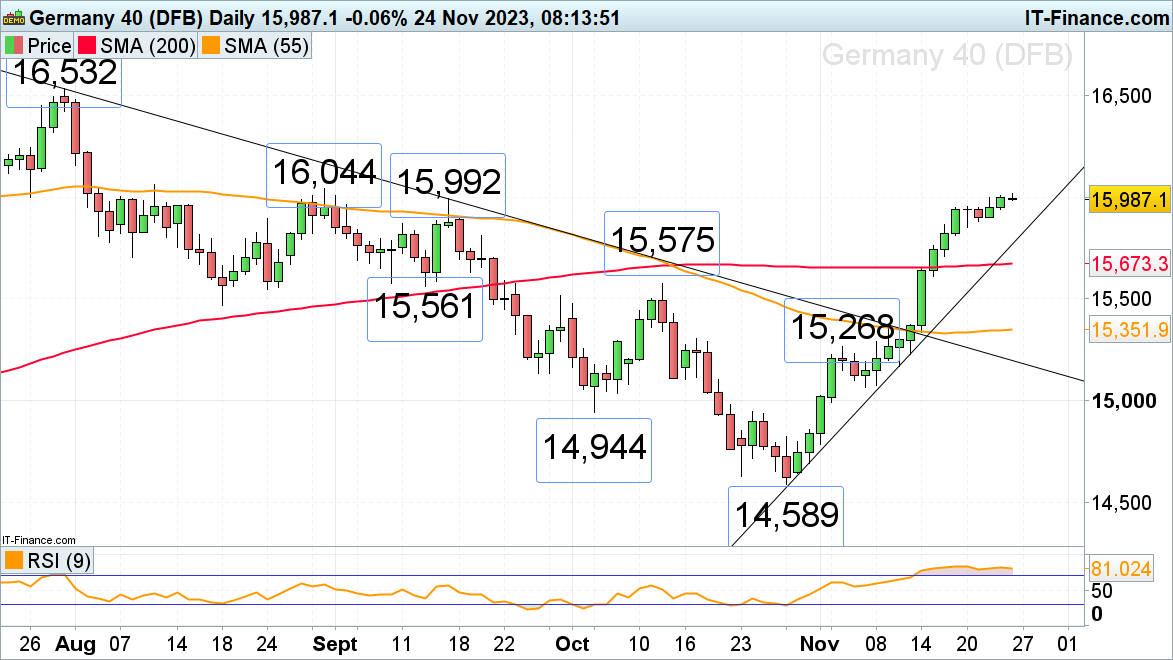
The DAX 40 continues to play with the psychological 16,000 mark despite Germany's economy contracting 0.1% in the third quarter, reversing its 0.1% growth in the previous quarter, ahead of today's IFO business climate index.
The August and September highs at 15,992 to 16,044 continue to act as a short-term resistance zone that caps.
Minor support below Thursday’s high at 15,867 can be made out at last Thursday’s 15,710 low. Further down meanders the 200-day simple moving average at 15,673.
DAX 40 Daily Chart
Download the Latest DAX 40 Client Sentiment Report
| Change in | Longs | Shorts | OI |
| Daily | 10% | 4% | 6% |
| Weekly | 14% | -11% | -4% |
Nasdaq 100 consolidates below its recent near two-year high
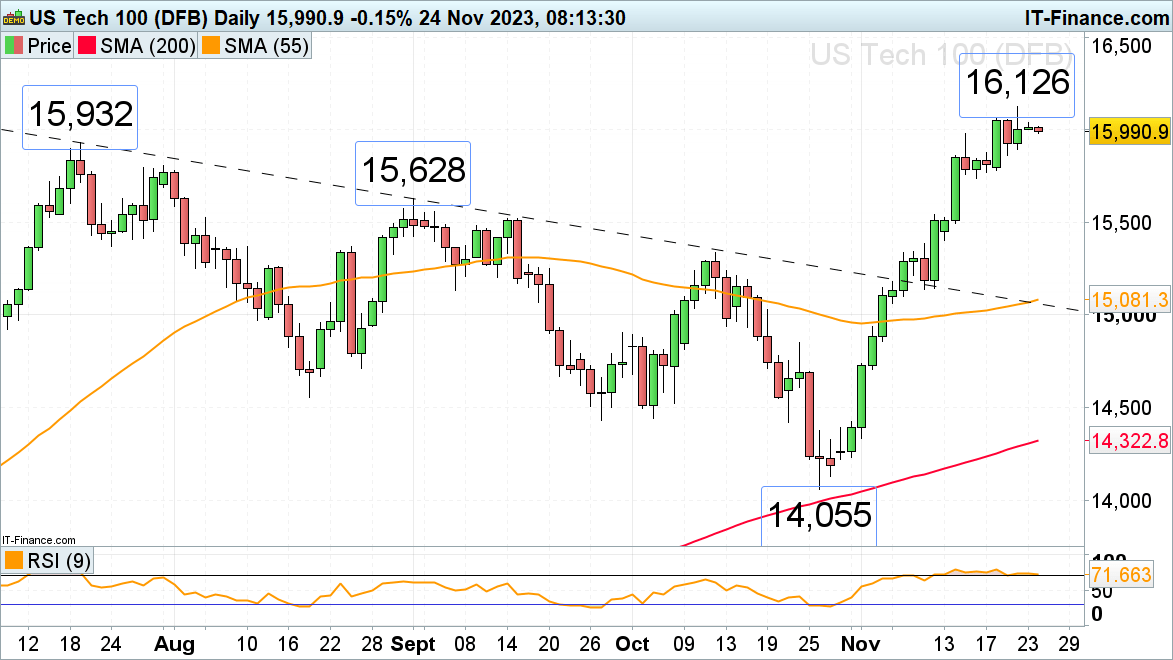
The Nasdaq 100’s stiff rally off its late October low has this week briefly taken the index to 16,126, a level last traded in January 2022, before consolidating in low volume ahead of the prolonged Thanksgiving weekend. With US markets shut for the second half of the day, the index is expected to trade in very little volume within a tight range but remains on track for its fourth straight week of gains.
The July high at 15,932 offers potential support while Monday’s 16,065 high may cap.
A rise into year-end above 16,126 would put the December 2021 high at 16,660 on the map.
Nasdaq 100 Daily Chart
Foundational Trading Knowledge
Trading Discipline
Recommended by IG


