


Oil Analysis, Prices, and Charts
- Traders concerned over potential retaliatory attacks.
- Supply chain fears over further Red Sea shipping disruption.
Learn how to trade Oil with our complimentary guide:

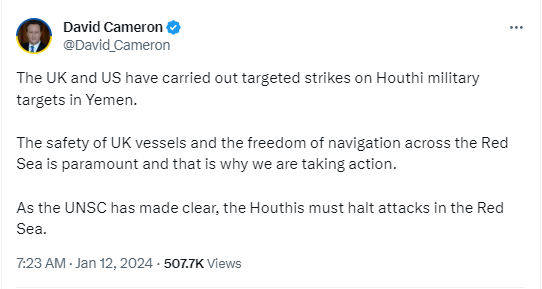
Financial markets are pricing in risk premiums to the price of oil after US and UK forces struck Houthi rebel targets in Yemen overnight. According to reports in The Daily Telegraph, US and UK air forces hit more than 60 targets in 16 different locations, including sites in and around airports, military bases, and a Houthi naval base.
The Middle East is critically important for global oil supply, with major producers including Saudi Arabia, Iraq, and UAE relying on vulnerable transportation routes including the strategic Bab el-Mandeb Strait next to Yemen. Around 4.8 million barrels of crude oil and refined products flow through this narrow passage each day.
Oil is also benefitting from a marginally lower US dollar after the yield on the rate-sensitive UST2-year fell yesterday, in part on increased haven demand. A weaker dollar makes oil less expensive for foreign buyers, increasing demand and pushing prices higher.
US crude is currently stuck between two Fibonacci retracement levels, the 61.8% level at $75.64/bbl. and the 78.6% level at $70.36/bbl. A negative 50-/200-day simple moving average crossover on December 22nd continues to weigh down on the price of oil, while the current spot price is bouncing off the 20-dsma and testing the 50-dsma. The chart shows the recent series of lower lows is now broken, while the series of lower highs remains intact until $76.14/bbl. is taken out.
Oil Daily Price Chart – January 12, 2024
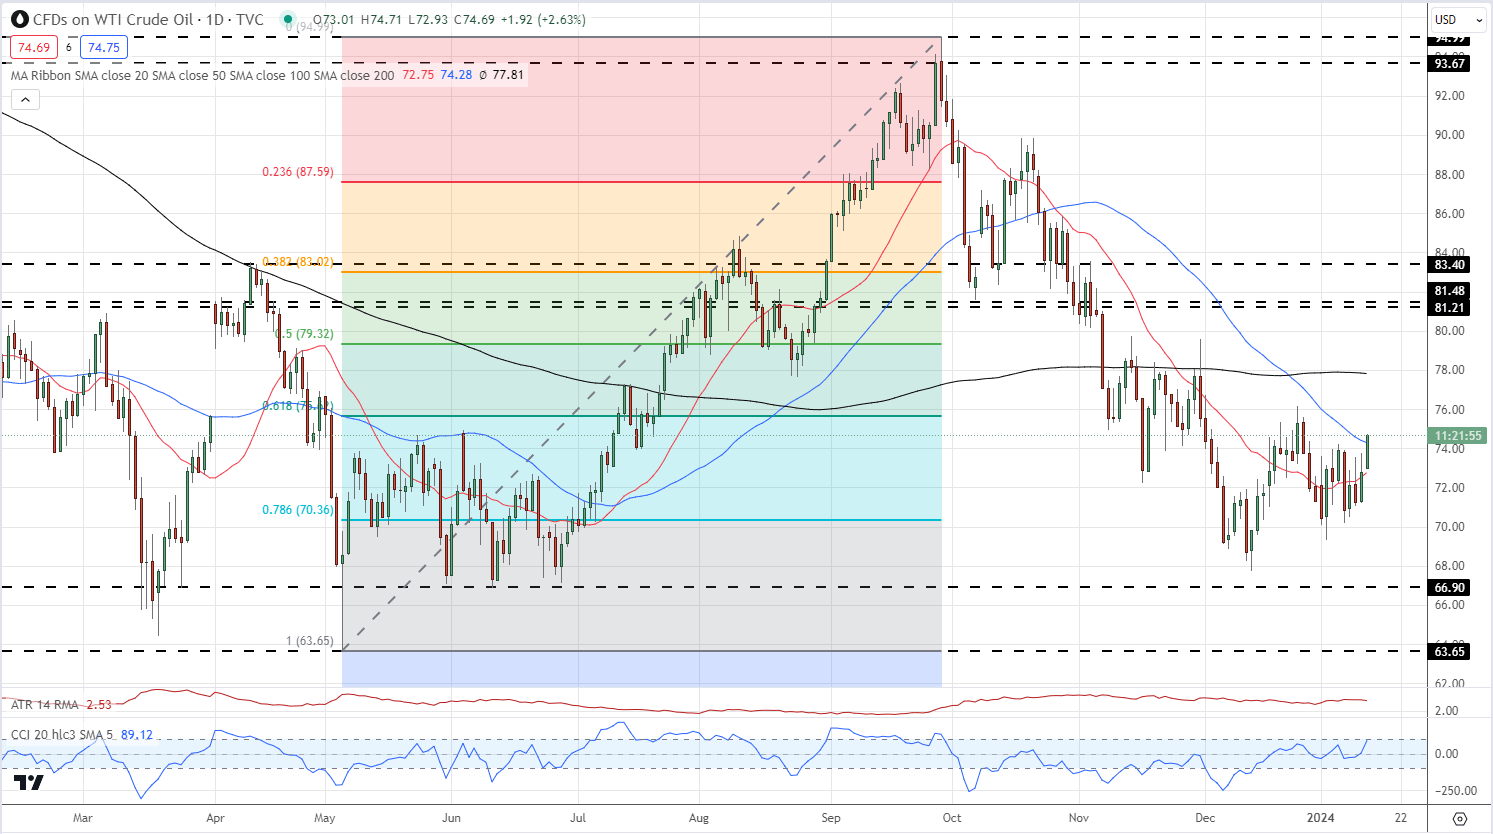
Chart via TradingView
IG Retail Trader data shows 82.49% of traders are net-long with the ratio of traders long to short at 4.71 to 1.The number of traders net-long is 8.62% lower than yesterday and 7.42% lower than last week, while the number of traders net-short is 49.13% higher than yesterday and 18.07% higher than last week.
We typically take a contrarian view to crowd sentiment, and the fact traders are net-long suggestsOil- US Crude prices may continue to fall.
Download the latest Sentiment Report to see how these daily and weekly changes affect price sentiment
| Change in | Longs | Shorts | OI |
| Daily | 5% | 0% | 3% |
| Weekly | 37% | -31% | 13% |
What is your view on Oil – bullish or bearish?? You can let us know via the form at the end of this piece or you can contact the author via Twitter @nickcawley1.


