


GBP/USD and GBP/NZD Analysis and Charts
- US dollar downgrade not showing in USD-crosses today.
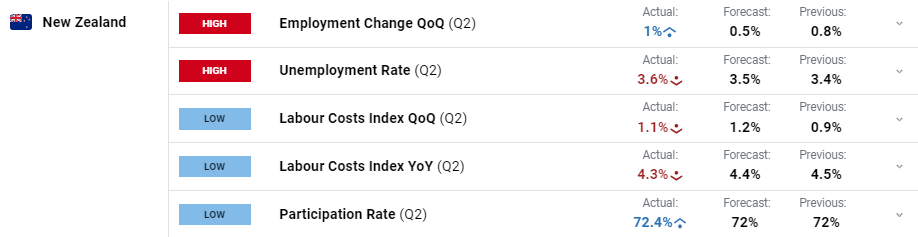
- GBP/NZD multi-year high as NZ unemployment grows.

Rating agency Fitch took a red pen to the US credit rating yesterday, downgrading it from AAA to AA+ with a stable outlook. The move, hinted at in May by the agency, was due to an ‘erosion of governance’ and ‘expected fiscal deterioration over the next three years’. The agency pointed to the potential default in June this year due to a political stand-off over raising the debt ceiling as one of its triggers.
For all market-moving events and data releases see the real-time DailyFX Calendar
GBP/USD took little notice of the downgrade and remained stuck in a narrow trading band. Sterling traders are waiting for Thursday’s latest BoE policy decision, with markets expecting a 25 basis point rate hike. This would push UK borrowing costs to their highest level in 15 years. Alongside the rate decision, the Bank of England will also publish their quarterly Monetary Policy Report which will show the central bank’s latest economic analysis and inflation projections.
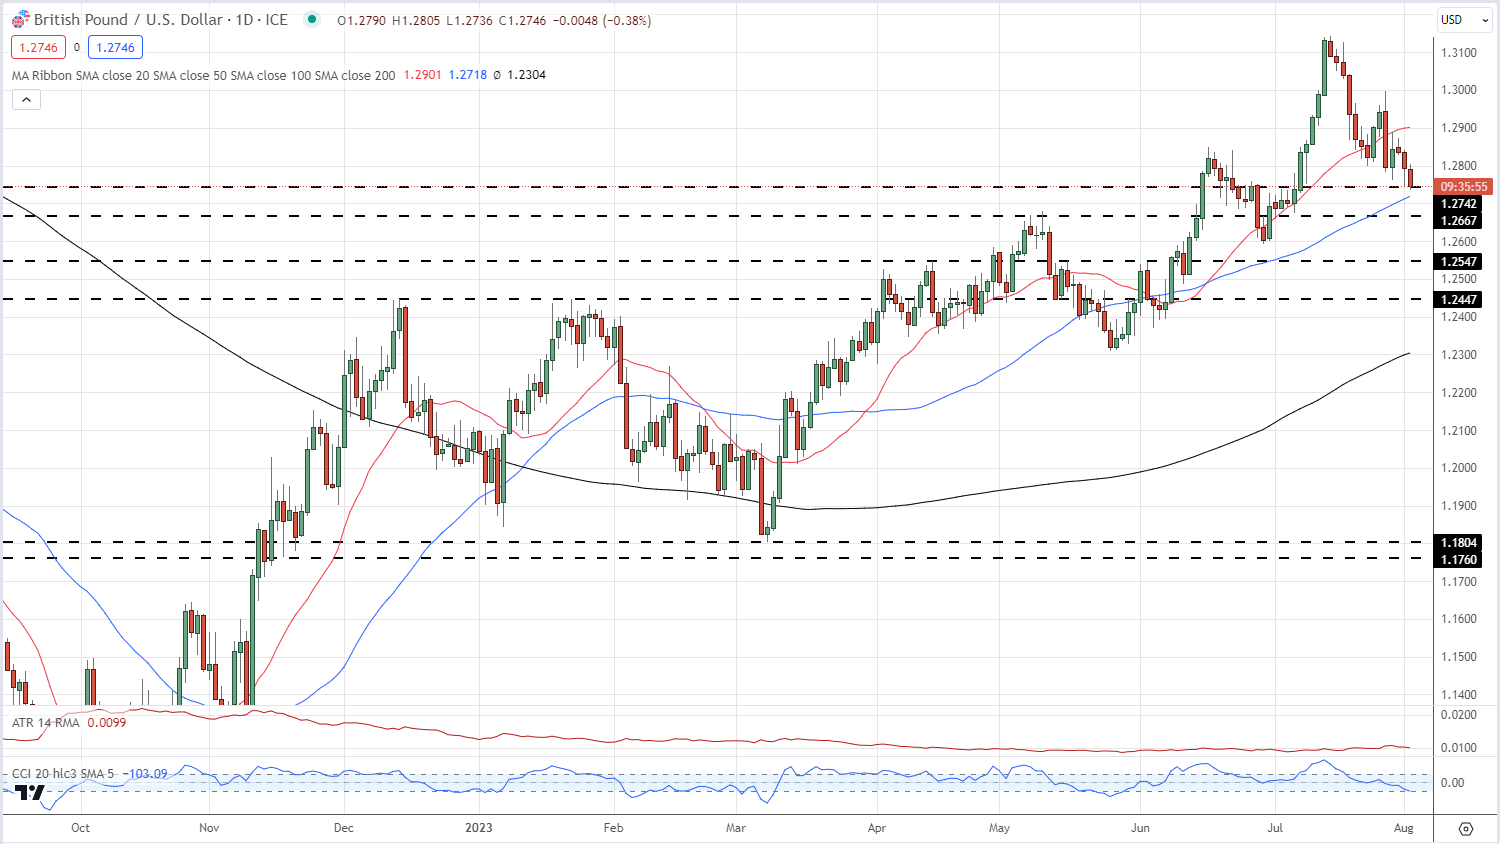
Cable (GBP/USD) is trading around 1.2750 with little to move it higher or lower ahead of tomorrow’s decision. The chart now shows the pair back under the 20-day simple moving average after breaking lower at the end of last week. The next levels of support are seen at 1.2667 and 1.2547.
GBP/USD Daily Price Chart – August 2, 2023
Retail trader data shows 53.07% of traders are net-long with the ratio of traders long to short at 1.13 to 1. Download the full guide, for free, below.
| Change in | Longs | Shorts | OI |
| Daily | -4% | 4% | -1% |
| Weekly | -4% | -1% | -3% |
The New Zealand dollar weakened further today after the latest jobs report showed the unemployment rate moving unexpectedly higher, while labour costs fell. A weaker labour market should push NZ inflation lower and give the central bank more time to leave rates unchanged.
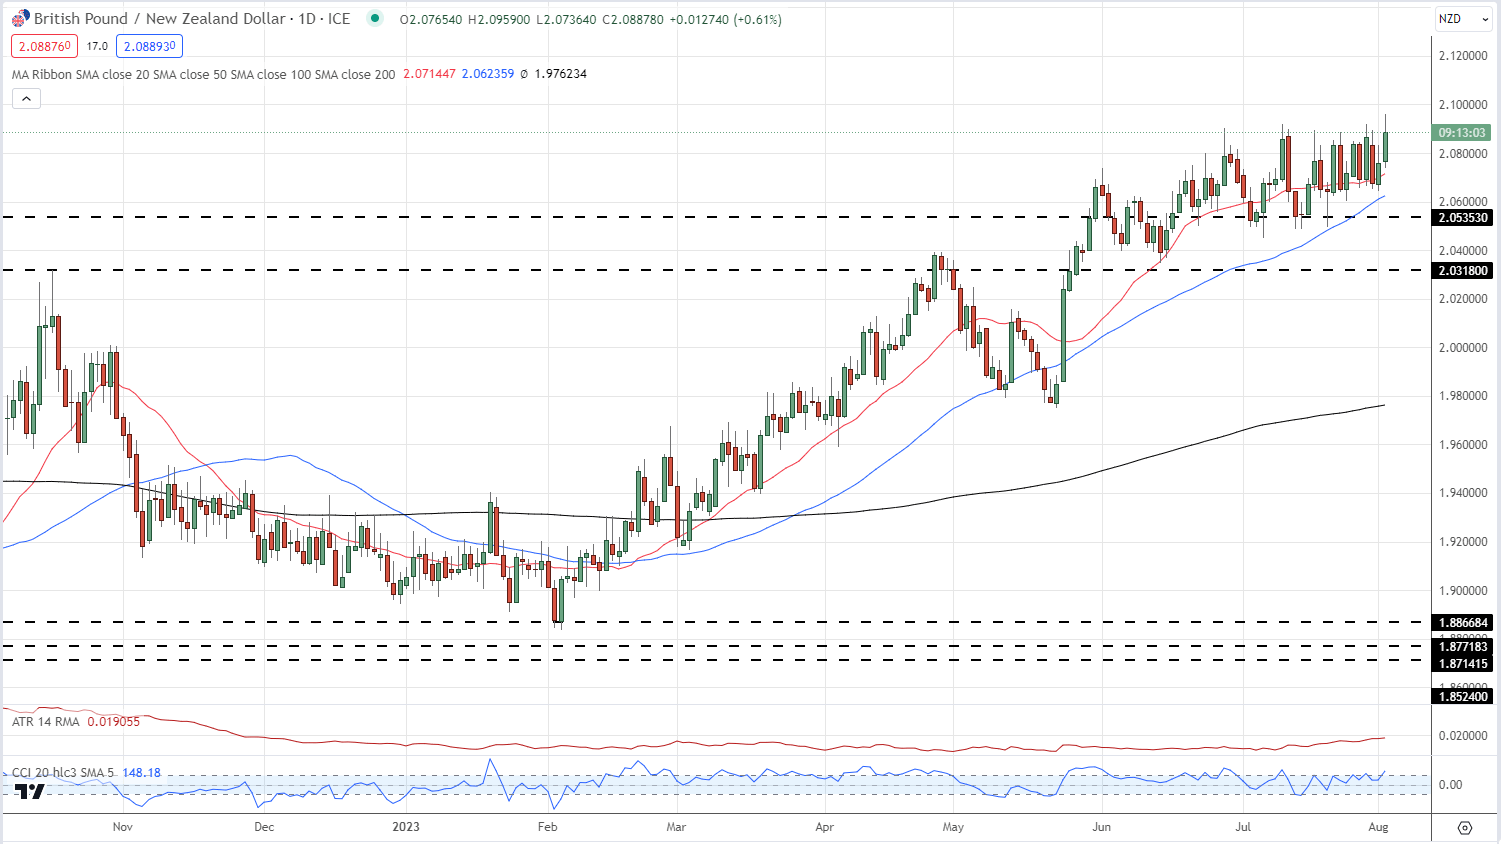
The New Zealand dollar has been weakening against the British Pound since the start of February when the pair traded around 1.8900. GBP/NZD posted a fresh three-year high of 2.0959 today. The move higher is supported by all three simple moving averages and while GBP/NZD may be in overbought territory, using the CCI indicator, it is not excessive. It seems that the pair may continue to grind higher, barring any unexpected news from the BoE tomorrow.
GBP/NZD Daily Price Chart – August 2, 2023
What is your view on the British Pound – bullish or bearish?? You can let us know via the form at the end of this piece or you can contact the author via Twitter @nickcawley1.


