
British Pound Vs US Dollar, Euro, Japanese Yen – Price Setups:
- GBP/USD is holding on to its recent gains.
- Speculative long GBP positioning is at the highest level since 2014.
- What is the outlook for GBP/USD, EUR/GBP, GBP/JPY?

The British pound is holding on to its recent gains ahead of the key UK inflation data due on Wednesday. UK CPI is expected to have eased a bit to 8.2% on-year in June from 8.7% in May. Core inflation is expected to be flat at 7.1% on-year. On a monthly basis, inflation eased to 0.4% on-month from 0.7% in May.
Inflation has remained stubbornly high, boosting expectations of higher for longer UK rates. BOE has responded by maintaining its aggressive stance on interest rates, hiking by more than expected in June, taking rates to the highest level since 2008. The market is pricing rates rising above 6% from the current 5%. As a result, net speculative long GBP positions have hit the highest level since 2014, according to CFTC data.
However, aggressive tightening could dent prospects for next year, raising the risk of a recession, and undermining the overbought GBP. On the other hand, the recent stimulus measures in China could help cushion some of the downside risks to economic growth in the world’s second-largest economy, providing a tailwind to European growth.
GBP/USD Daily Chart
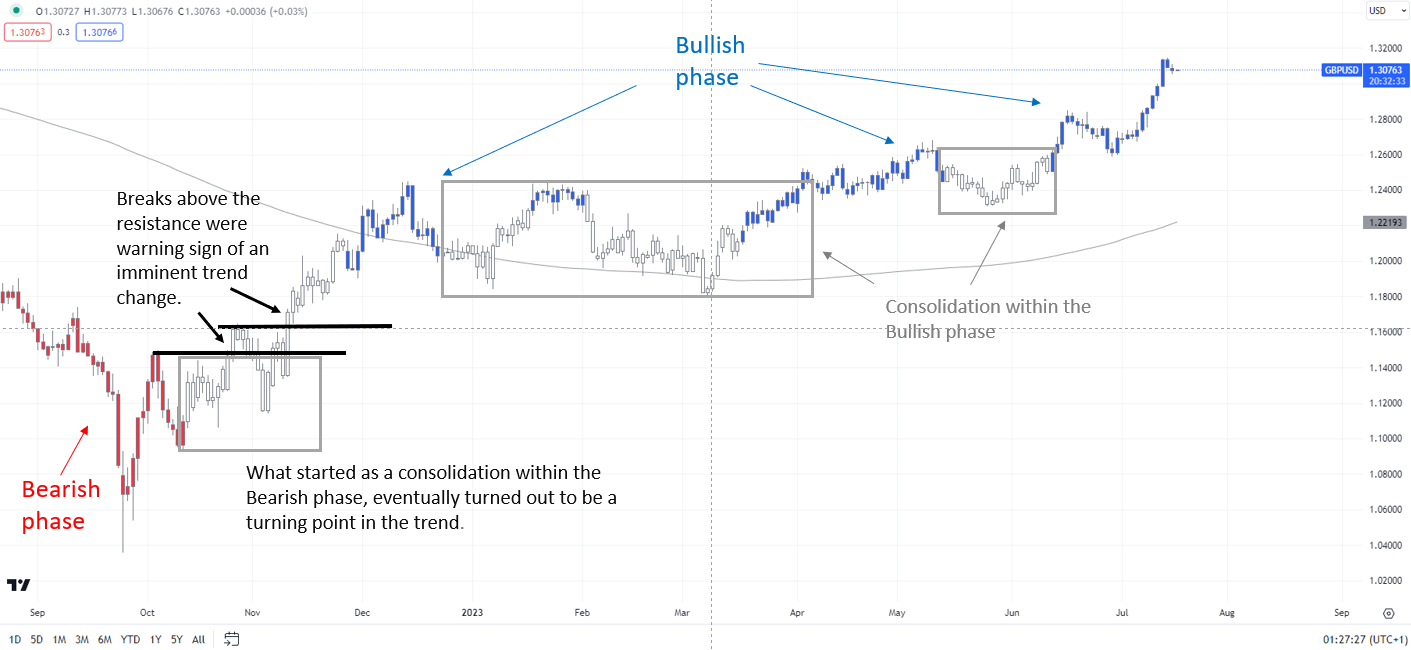
Chart Created by Manish Jaradi Using TradingView; Notes at the bottom of the page
GBP/USD: Holding gains
From a trend perspective, GBP/USD’s broader trend remains up, as the colour-coded daily candlestick charts show. Beyond the daily timeframe, from a medium-term perspective, the rise this month to a one-year high in May confirmed the higher-tops-higher-bottom sequence since late 2022, leaving open the door for some medium-term gains. (see “British Pound Buoyant Ahead of BOE: How Much More Upside?”, published May 8).
GBP/USD Weekly Chart
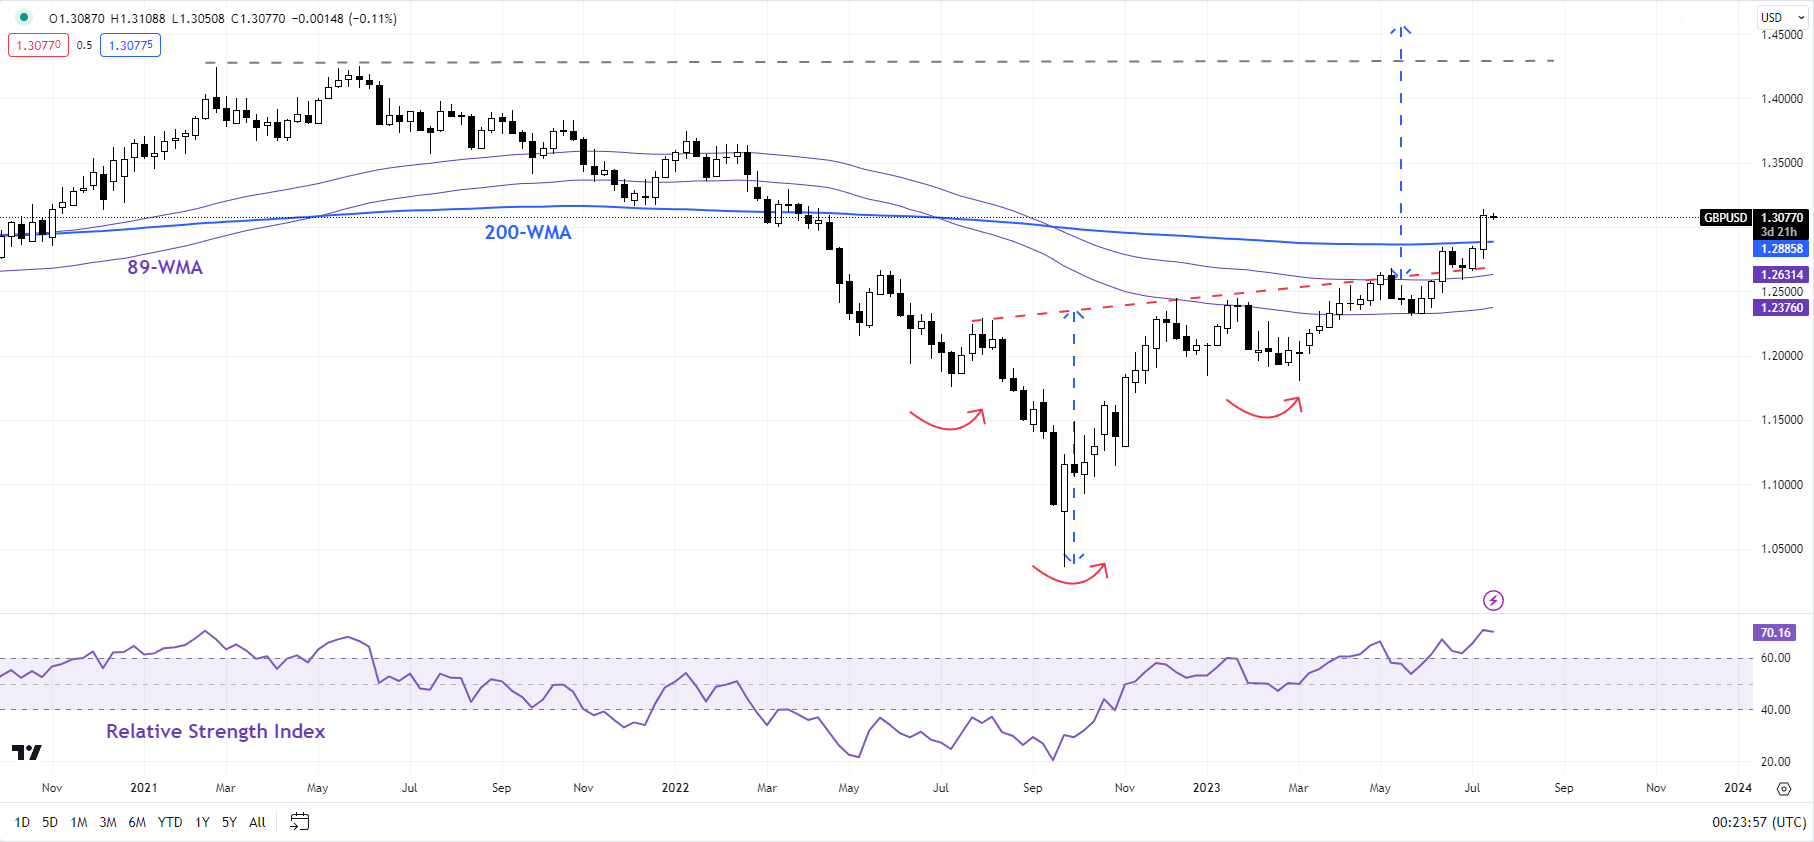
Chart Created by Manish Jaradi Using TradingView
The rise to a 15-month high last week has pushed GBP/USD above a vital hurdle on the 200-week moving average. A decisive break (two straight weeks of close above) could open the gates for further gains. That’s because the rise above a slightly upward-sloping trendline from late 2022 has triggered a reverse head & shoulders pattern (the left shoulder is at the July 2022 low, the head is at the September 2022 low, and the right shoulder is at the Q1-2023 low), pointing to a move toward 2021 high of 1.4250 over the longer term.
EUR/GBP Daily Chart
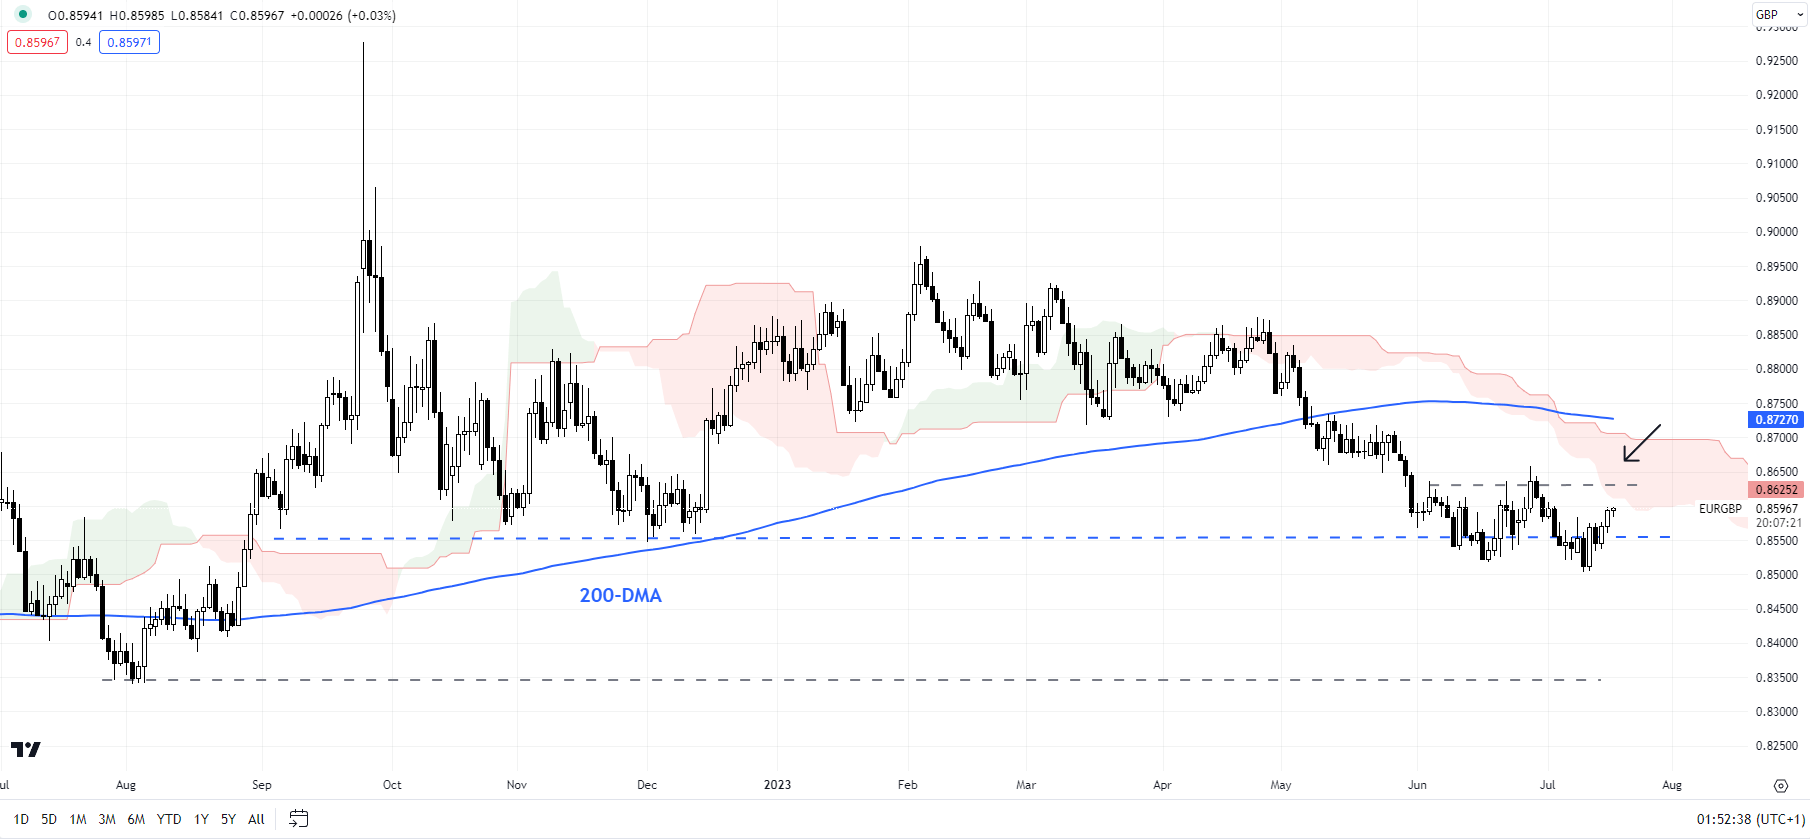
Chart Created Using TradingView
EUR/GBP: Still holding above key support
EUR/GBP’s slide has stalled in recent weeks around key support at the December low of 0.8545, with a potential minor double bottom unfolding (the June low and the early-July low). Still, the bias remains down while the cross remains below the end-June high of 0.8635. However, a break above 0.8635 would trigger the bullish pattern, pointing to a rise toward 0.8750, confirming that the immediate downward pressure had faded.
GBP/JPY Monthly Chart
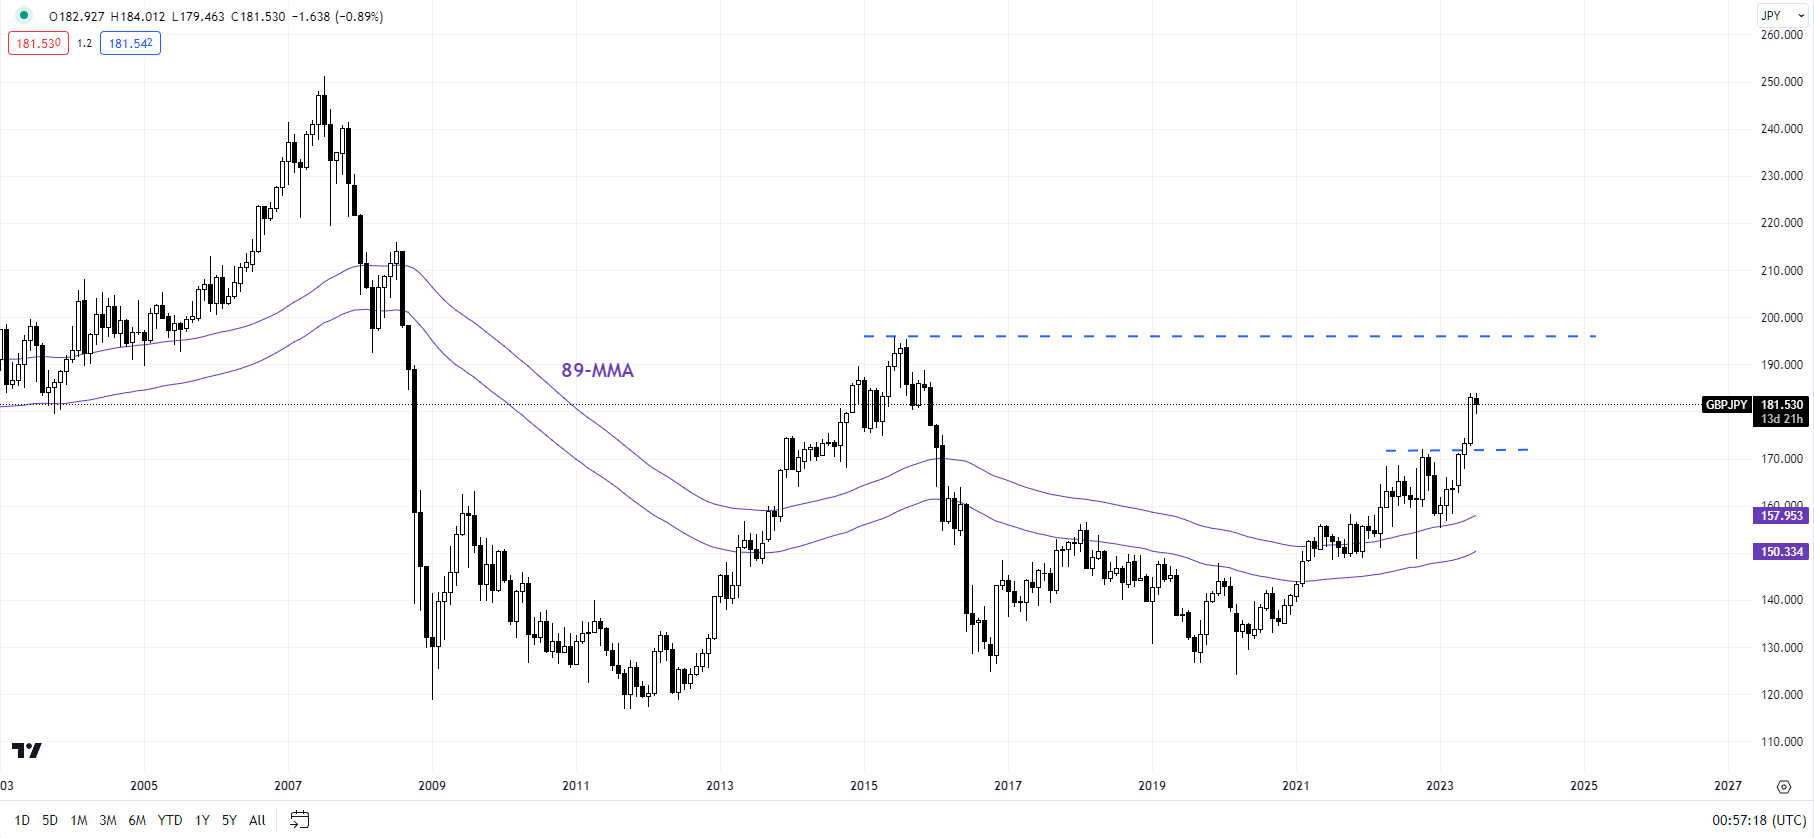
Chart Created Using TradingView
GBP/JPY: On the way toward the 2015 high
GBP/JPY’s break above the October high of around 172.00 has opened the door toward the 2015 high of 196.00 in the coming weeks/months. In the near term, however, the cross looks a bit overbought. Hence some sort of consolidation/minor retreat can’t be ruled out. The broader upward pressure is unlikely to fade away while the cross holds above the 89-day moving average (now around 173.10).
Note: The above colour-coded chart(s) is(are) based on trending/momentum indicators to minimize subjective biases in trend identification. It is an attempt to segregate bullish Vs bearish phases, and consolidation within a trend Vs reversal of a trend. Blue candles represent a Bullish phase. Red candles represent a Bearish phase. Grey candles serve as Consolidation phases (within a Bullish or a Bearish phase), but sometimes they tend to form at the end of a trend. Candle colors are not predictive – they merely state what the current trend is. Indeed, the candle color can change in the next bar. False patterns can occur around the 200-period moving average, around a support/resistance, and/or in a sideways/choppy market. The author does not guarantee the accuracy of the information. Past performance is not indicative of future performance. Users of the information do so at their own risk.

--- Written by Manish Jaradi, Strategist for DailyFX.com
--- Contact and follow Jaradi on Twitter: @JaradiManish