


US Dollar Price Action Talking Points
- In this archived webinar, the USD breakdown was the center of the discussion.
- Setups were looked at in majors markets, spanning EUR/USD, AUD/USD, USD/CAD, GBP/USD and extending over to Gold, Oil and US equities.
- A follow-up article has been published, looking into some of these markets in the piece entitled, US Dollar Breakdown: EUR/USD, AUD/USD, GBP/USD Break Outs.
USD Breaks Down
The US Dollar finally broke below the big support zone at 95.86-96.05. This zone has been in-play in various ways since early-2019, as this helped to set the low for the bulk of last year. Even when price action was going through mayhem in March, this zone helped to set the low, albeit temporarily, before prices pushed lower to establish a fresh one-year-low; but even that was a fleeting move as prices soon broke back-above and allowed for just one daily close below this support zone in the past year.

But – prices have now broken down and the US Dollar is already making a fast run at the 95.00 level which, similarly, has some historical implications on USD. On the below weekly chart of the US Dollar, in orange, towards the left, is emphasis on 2018 and 2019 price action around the 95.00 level on DXY. This zone helped to provide about three months of resistance from May to July 2018; and then soon came in as support to help hold the 2019 lows over a couple of different tests. It’s been a long time since that level was back in-play, of course save for the one daily close that was seen in a brutal month of March trade.
US Dollar Weekly Price Chart
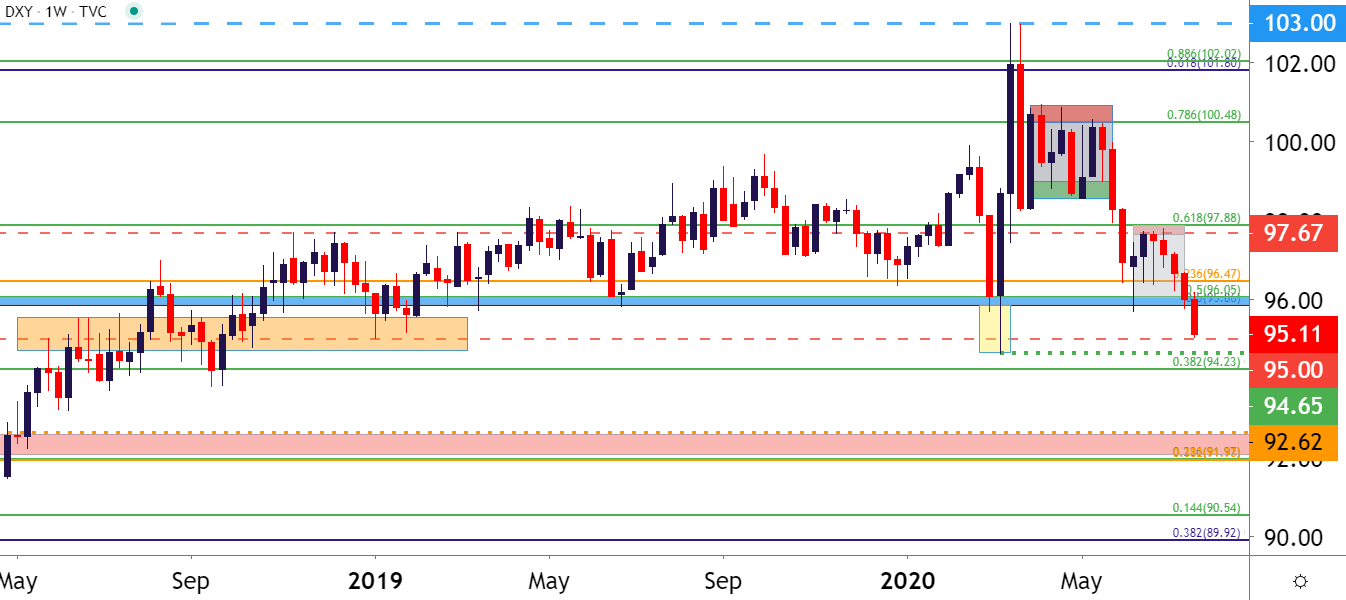
Chart prepared by James Stanley; USD, DXY on Tradingview
--- Written by James Stanley, Strategist for DailyFX.com
Contact and follow James on Twitter: @JStanleyFX


