


US Dollar Price Action Talking Points:
- The US Dollar has gained into this morning with a bit of position squaring ahead of Jackson Hole.
- This webinar looks at setups across the US Dollar.
- DailyFX Forecasts are published on a variety of markets such as Gold, the US Dollar or the Euro and are available from the DailyFX Trading Guides page. If you’re looking to improve your trading approach, check out Traits of Successful Traders. And if you’re looking for an introductory primer to the Forex market, check out our New to FX Guide.
The Jackson Hole Economic Symposium is now just around-the-corner and the US Dollar has pushed right back towards prior resistance around the 98.50 level in advance. The Greenback put in five consecutive days of gains, further recovering from the post-FOMC sell-off after the additional tariffs on China were announced. Today’s price action is working on a not-yet-completed bearish engulfing, which could keep the door open for bearish USD setups. In this webinar, I looked at areas of interest on both sides of the matter.
US Dollar Daily Price Chart
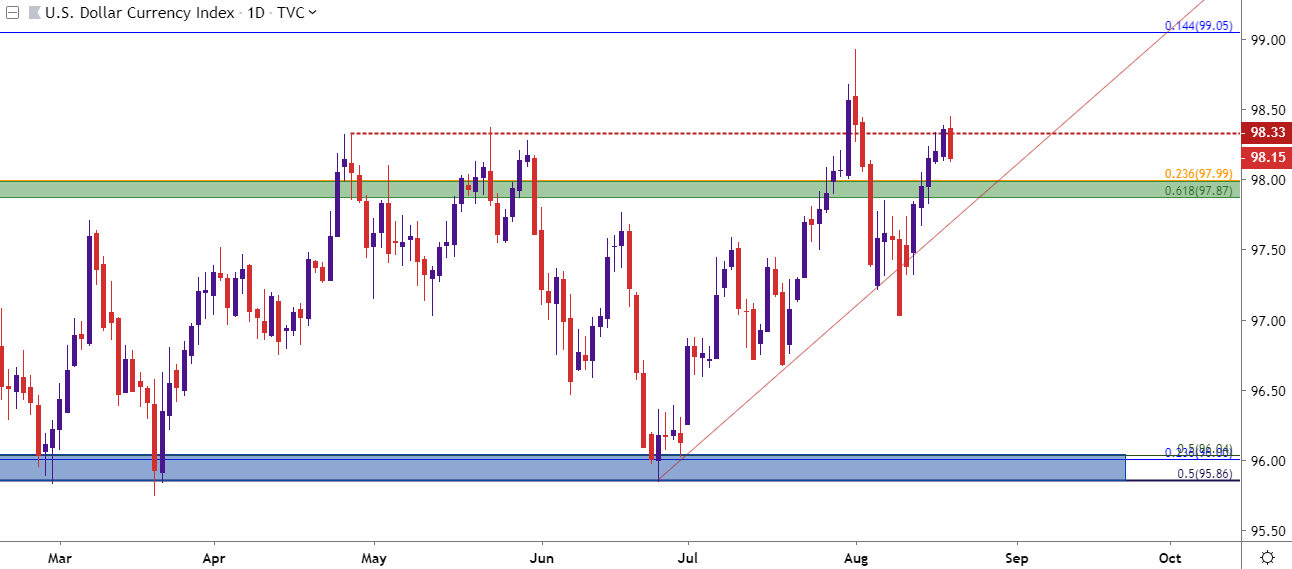
Chart prepared by James Stanley; US Dollar on Tradingview
EUR/USD Bears Still Looking for that Next Driver
There have been some pretty bearish facts coming into play around the Euro over the past week. This morning brought the resignation of the Italian Prime Minister, which has actually led to a net move of strength so far. Last week brought the announcement that the ECB was looking at ‘something big’ for their September rate decision. I’m keeping EUR/USD on the long-USD side of the ledger going into Jackson Hole, anticipating that USD-strength may price in well here should that theme come about from the FOMC not sounding as dovish as what markets are looking for.
EUR/USD Eight-Hour Price Chart
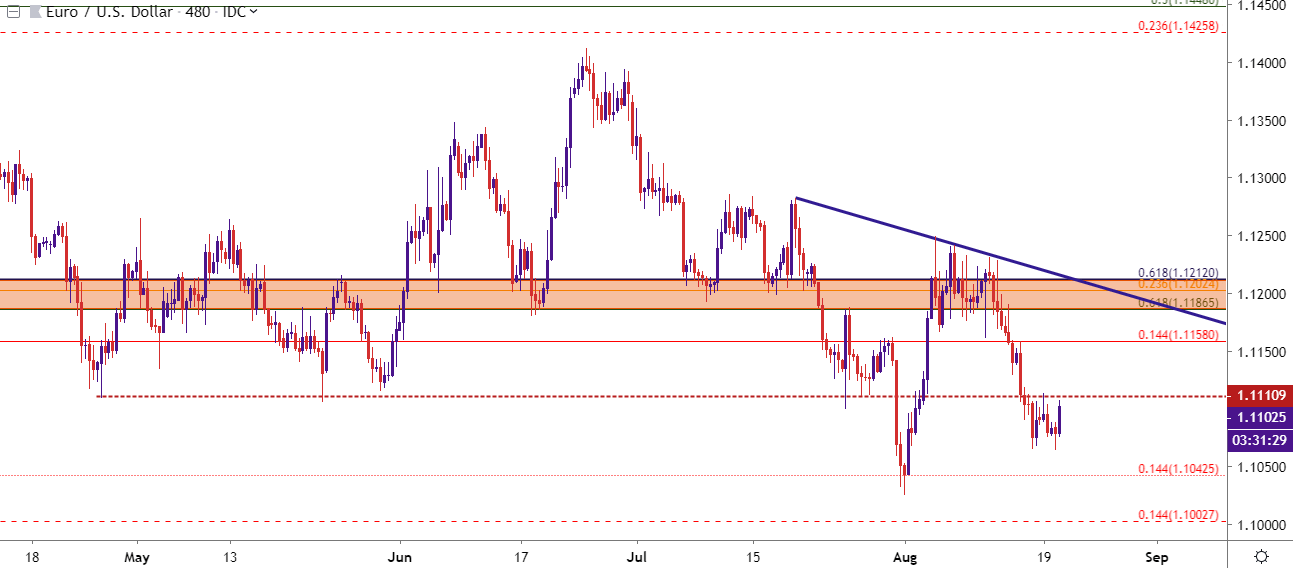
Chart prepared by James Stanley; EURUSD on Tradingview
GBP/USD Bulls Push
I looked at the long side of GBP/USD and the pair has continued to develop in that direction over the past week. A long-term trendline came into play a few weeks ago and since then, sellers haven’t been able to push down to a fresh low. I’m continuing to look at topside, although price proximity to resistance was unattractive at the moment. But, a forward push up to 1.2250 keeps the door open for support at prior resistance 1.2191-1.2211.
GBP/USD Hourly Price Chart
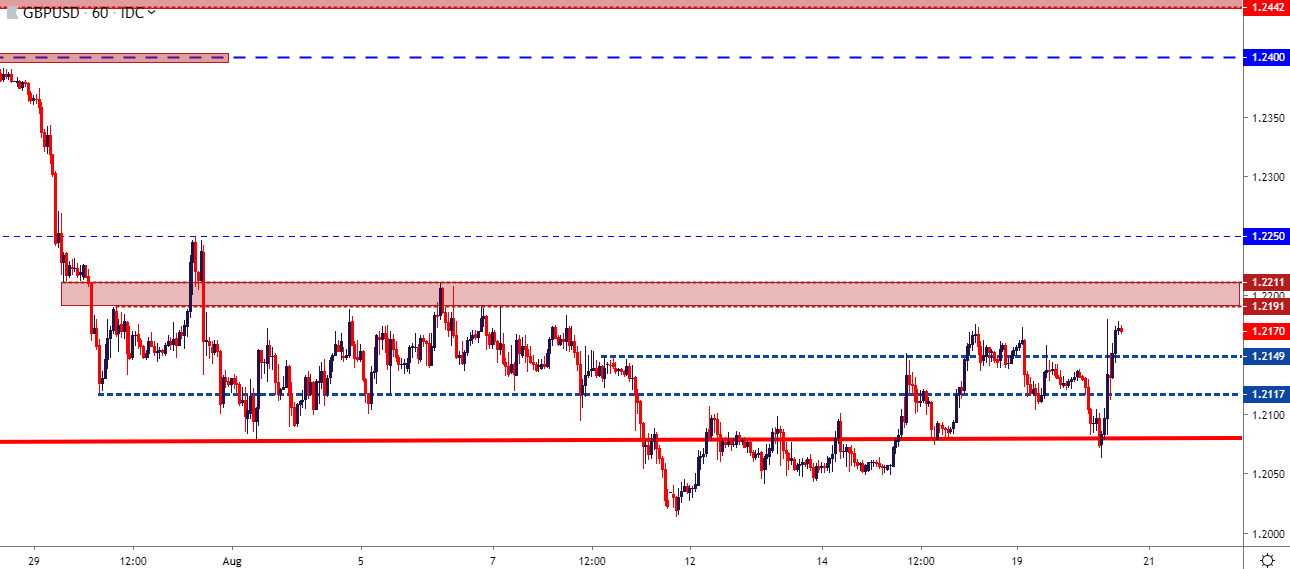
Chart prepared by James Stanley; GBPUSD on Tradingview
USD/JPY Swing Potential
I’m not a huge fan of the current setup in USD/JPY but, as shown in the webinar, the potential for short-side swings is there with a hold of lower-high resistance taken from a Fibonacci level at 106.66.
USD/JPY Four-Hour Price Chart
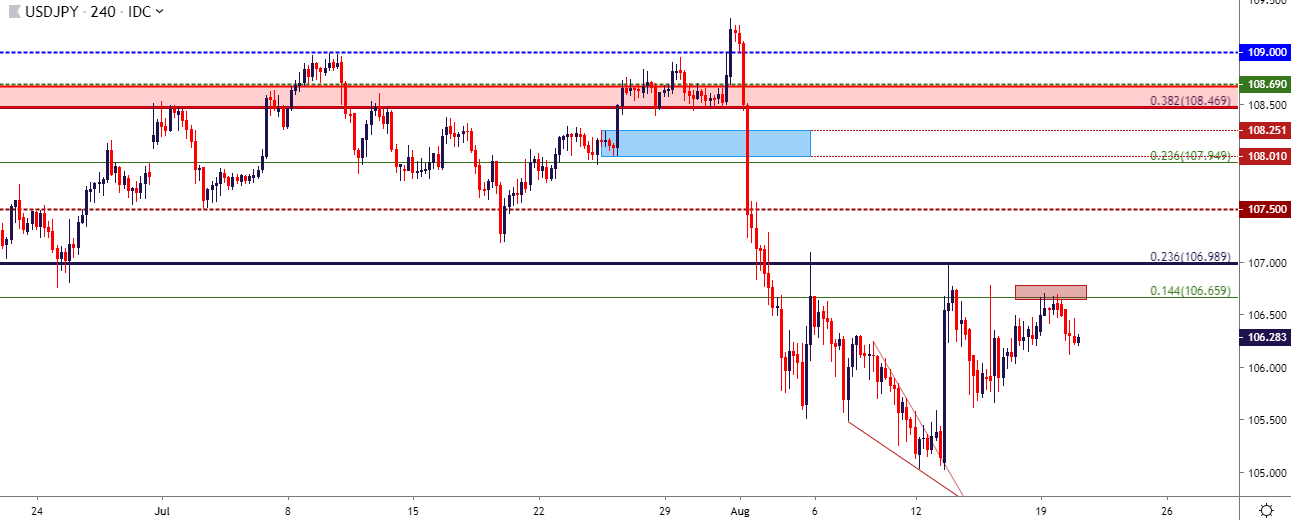
Chart prepared by James Stanley; USD/JPY on Tradingview
USD/CHF: SNB Intervening, Time to Flip?
Recent reports indicate that the Swiss National Bank has been actively intervening in markets to stem Franc strength against the Euro. This makes the prospect of short-side scenarios in USD/CHF not as attractive as they were last week, and there may even be scope for a bullish reversal, particularly for long-USD scenarios.
USD/CHF Two-Hour Price Chart
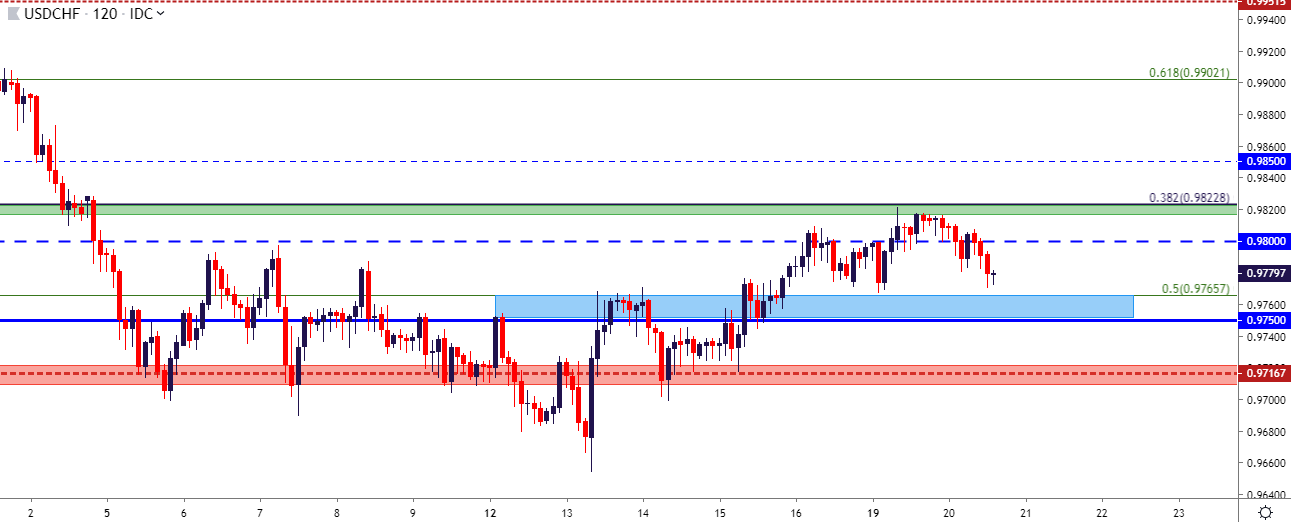
Chart prepared by James Stanley; USD/CHF on Tradingview
AUD/USD Holds Support – Bullish Defense No More?
I’ve been following the .6750 price on AUD/USD for a little while now and, so far, this has helped to hold sellers at bay over the past few weeks. But – each of those responses are bringing less and less firepower, leading to the build of a descending triangle. This can open the door to the short side of the pair, looking for that price of .6750 to soon become breached.
AUD/USD Two-Hour Price Chart
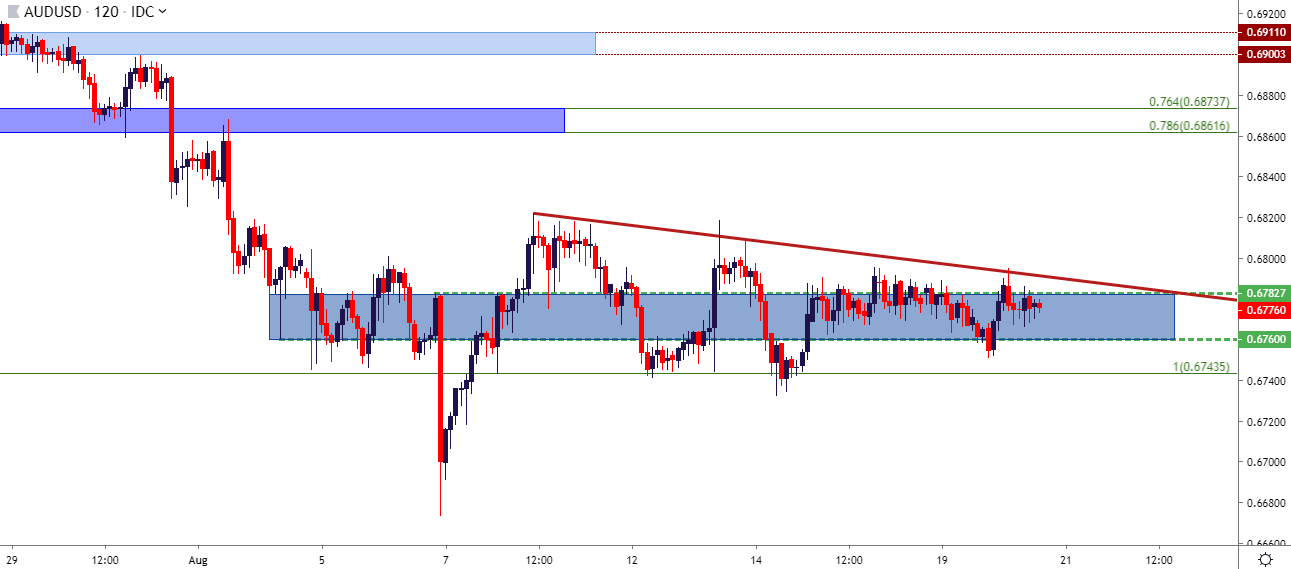
Chart prepared by James Stanley; AUD/USD on Tradingview
NZD/USD Builds Support from Key Fib
On the opposite end of the spectrum, NZD/USD continues to show evidence of having bottomed. Last week I looked at the initial build of a falling wedge pattern and this led to a continued test of support at the .6403 Fibonacci level, which is the 61.8% marker of the 2008-2011 major move in the pair. This can open the door to bullish reversal potential, initially targeting .6450, followed by a re-test of the area around .6500.
NZD/USD Hourly Price Chart
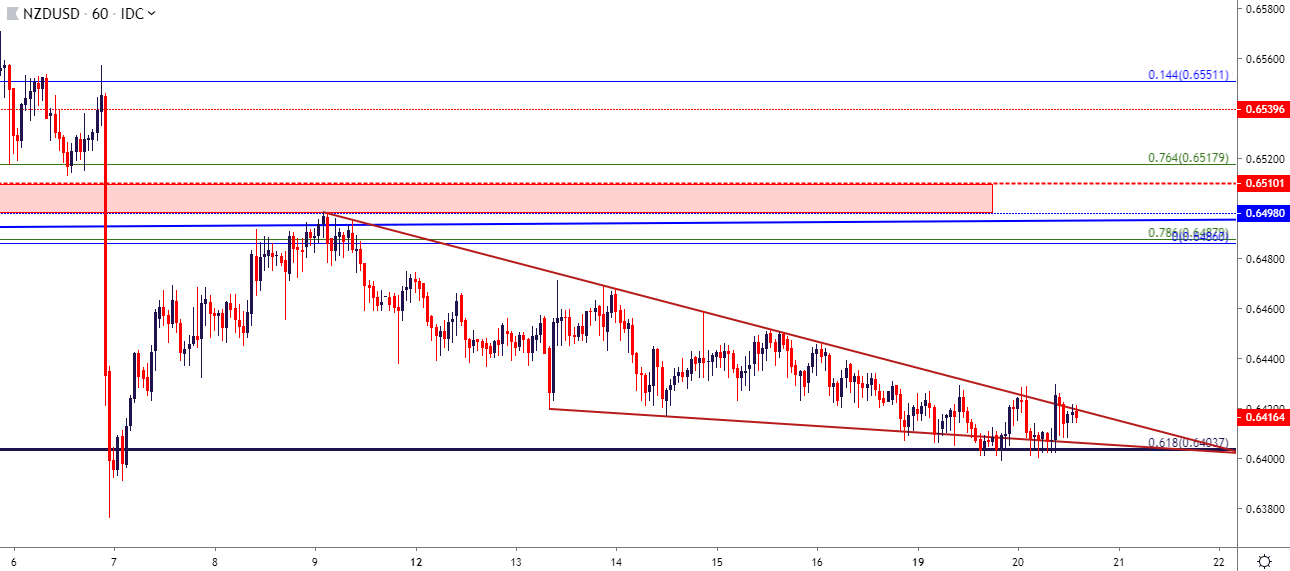
Chart prepared by James Stanley; NZD/USD on Tradingview
USD/CAD: Turn Not Yet Ready, but Perhaps Soon
I’ve been following USD/CAD for a bearish turn of recent but that hasn’t yet shown up. Prices at this point continue to test resistance around multi-week highs, and there isn’t yet evidence that sellers are ready to make a push. However, tomorrow brings Canadian inflation and that could soon change. Resistance potential remains in the 1.3361-1.3385 area on the chart.
USD/CAD Four-Hour Price Chart
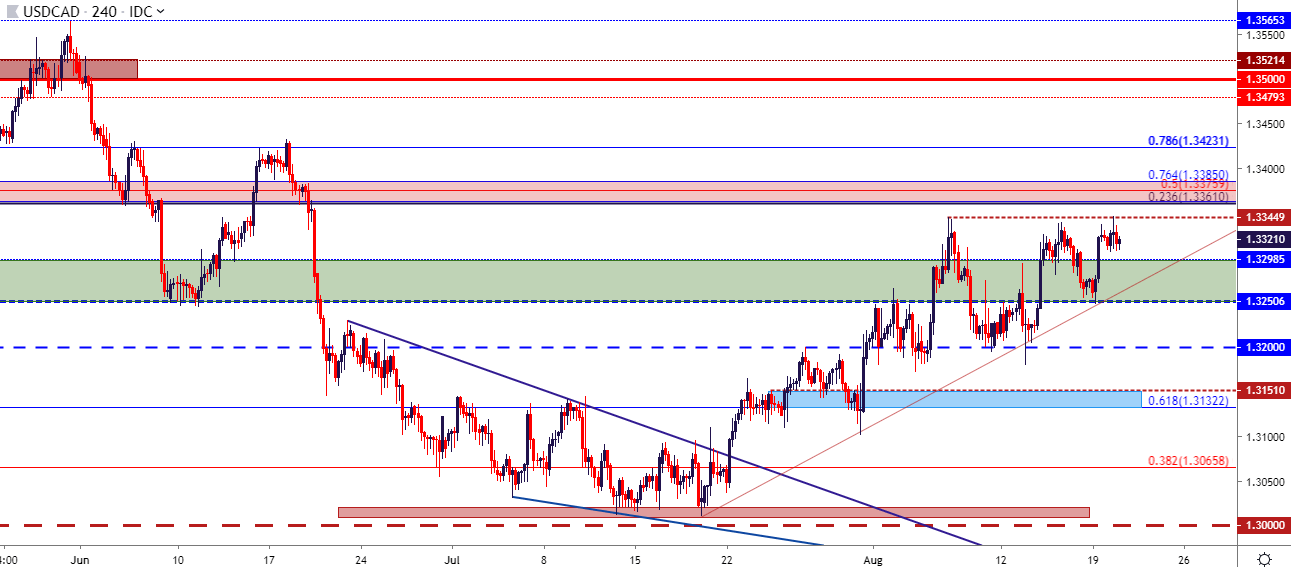
Chart prepared by James Stanley; USDCAD on Tradingview
To read more:
Are you looking for longer-term analysis on the U.S. Dollar? Our DailyFX Forecasts have a section for each major currency, and we also offer a plethora of resources on Gold or USD-pairs such as EUR/USD, GBP/USD, USD/JPY, AUD/USD. Traders can also stay up with near-term positioning via our IG Client Sentiment Indicator.
Forex Trading Resources
DailyFX offers an abundance of tools, indicators and resources to help traders. For those looking for trading ideas, our IG Client Sentiment shows the positioning of retail traders with actual live trades and positions. Our trading guides bring our DailyFX Quarterly Forecasts and our Top Trading Opportunities; and our real-time news feed has intra-day interactions from the DailyFX team. And if you’re looking for real-time analysis, our DailyFX Webinars offer numerous sessions each week in which you can see how and why we’re looking at what we’re looking at.
If you’re looking for educational information, our New to FX guide is there to help new(er) traders while our Traits of Successful Traders research is built to help sharpen the skill set by focusing on risk and trade management.
--- Written by James Stanley, Strategist for DailyFX.com
Contact and follow James on Twitter: @JStanleyFX


